
The Premise
Two lineages, one geometry. Andrews' median line work and Gann's geometric price-time charts converge in the Hyperfork.
Dr. Alan Andrews' Action-Reaction method — Newton's third law applied to price, which Andrews learned from Roger Babson — uses three pivots to draw a median line with action and reaction parallels framing the trend's channel.
W.D. Gann worked with price-time charts and geometrically scaled charts — the Square of Nine and the Hexagon Chart, etc., which, in my understanding, aim to model the expansion and contraction of price and time.
I had never seen the two come together until I built the Hyperfork.
[CHART 1 — Hyperfork base: action and reaction lines layered over three pivots, no cube highlighted]

The Discovery
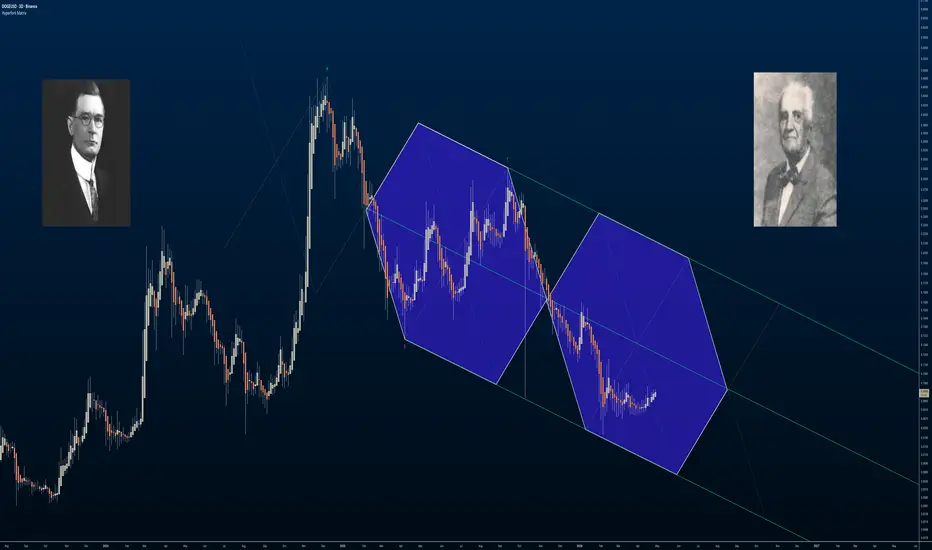
The Hyperfork extends Andrews/Mikula's Superpitchfork — multiple action-reaction lines layered over the same three pivots. When those lines surface, a two-dimensional hexagon emerges within the Hyperfork. Viewed differently, the same hexagon reads as a cube.
That was the moment. The hexagon-as-cube is the connection — the first time I saw Andrews' median geometry and hexagonal geometry coexist on the same chart.
[CHART 2 — same Hyperfork chart with the 2D hexagon/cube highlighted]

The Research Direction
If the cube is the unit, the next question is what fills it.
Each cube cell can contain 13 reference points: 1 center, 6 on the outer ring at the cell tips, and 6 on the inner ring forming a nested hexagon at half scale. Connect every pair of nodes, and the figure becomes part of my attempt to produce a Metatron's Cube — a network of nodes and chord relations.
Where Andrews anchors a single median per fork, the lattice surfaces every pairwise chord between every node — a more complete relational map of the same three pivots.
[CHART 3 — Metatron's Cube research extension: 13 nodes visible inside each cube cell]

What I'm Exploring
Whether price interacts meaningfully with the lattice and its nodes. Whether the outer ring marks macro pivot candidates. Whether the inner hexagon contains a higher-density confluence zone. Whether the chord crossings function as time-price reference points.
The main question I want to answer is: Does Andrews' 80% rule apply throughout other parts of the lattice? If price tends to return to the parent median about 80% of the time, does this statistical property hold at every cube cell — including each local median axis, nested hexagon, and chord intersection?
Open questions, not claims. This is a research direction, not a method.
Open questions, not claims. This is a research direction, not a method.
Setup
For reproducibility on the chart shown:
Three pivots picked from major swing points. Everything else is default.
Reference & Lineage
Built on the open-source Hyperfork Matrix. The 13-node Metatron lattice is a research-stage extension; this idea timestamps the direction.
Lineage: Babson → Andrews/Schiff → Mikula → here. Patrick Mikula's The Best Trendline Methods of Alan Andrews and Five New Trendline Techniques extended Andrews' framework and is the direct foundation for this research
Two lineages, one geometry. Andrews' median line work and Gann's geometric price-time charts converge in the Hyperfork.
Dr. Alan Andrews' Action-Reaction method — Newton's third law applied to price, which Andrews learned from Roger Babson — uses three pivots to draw a median line with action and reaction parallels framing the trend's channel.
W.D. Gann worked with price-time charts and geometrically scaled charts — the Square of Nine and the Hexagon Chart, etc., which, in my understanding, aim to model the expansion and contraction of price and time.
I had never seen the two come together until I built the Hyperfork.
[CHART 1 — Hyperfork base: action and reaction lines layered over three pivots, no cube highlighted]
The Discovery
The Hyperfork extends Andrews/Mikula's Superpitchfork — multiple action-reaction lines layered over the same three pivots. When those lines surface, a two-dimensional hexagon emerges within the Hyperfork. Viewed differently, the same hexagon reads as a cube.
That was the moment. The hexagon-as-cube is the connection — the first time I saw Andrews' median geometry and hexagonal geometry coexist on the same chart.
[CHART 2 — same Hyperfork chart with the 2D hexagon/cube highlighted]
The Research Direction
If the cube is the unit, the next question is what fills it.
Each cube cell can contain 13 reference points: 1 center, 6 on the outer ring at the cell tips, and 6 on the inner ring forming a nested hexagon at half scale. Connect every pair of nodes, and the figure becomes part of my attempt to produce a Metatron's Cube — a network of nodes and chord relations.
Where Andrews anchors a single median per fork, the lattice surfaces every pairwise chord between every node — a more complete relational map of the same three pivots.
[CHART 3 — Metatron's Cube research extension: 13 nodes visible inside each cube cell]
What I'm Exploring
Whether price interacts meaningfully with the lattice and its nodes. Whether the outer ring marks macro pivot candidates. Whether the inner hexagon contains a higher-density confluence zone. Whether the chord crossings function as time-price reference points.
The main question I want to answer is: Does Andrews' 80% rule apply throughout other parts of the lattice? If price tends to return to the parent median about 80% of the time, does this statistical property hold at every cube cell — including each local median axis, nested hexagon, and chord intersection?
Open questions, not claims. This is a research direction, not a method.
Open questions, not claims. This is a research direction, not a method.
Setup
For reproducibility on the chart shown:
- Pitchfork type: Modified Schiff
- Price scale: Logarithmic
Three pivots picked from major swing points. Everything else is default.
Reference & Lineage
Built on the open-source Hyperfork Matrix. The 13-node Metatron lattice is a research-stage extension; this idea timestamps the direction.
Lineage: Babson → Andrews/Schiff → Mikula → here. Patrick Mikula's The Best Trendline Methods of Alan Andrews and Five New Trendline Techniques extended Andrews' framework and is the direct foundation for this research

© 2026 Blueprint Research LLC · Hyperfork Matrix™
All indicators · CC BY-NC-SA 4.0 · Inquiries: blueprintresearch9@gmail.com
All indicators · CC BY-NC-SA 4.0 · Inquiries: blueprintresearch9@gmail.com
Clause de non-responsabilité
Les informations et publications ne sont pas destinées à être, et ne constituent pas, des conseils ou recommandations financiers, d'investissement, de trading ou autres fournis ou approuvés par TradingView. Pour en savoir plus, consultez les Conditions d'utilisation.
© 2026 Blueprint Research LLC · Hyperfork Matrix™
All indicators · CC BY-NC-SA 4.0 · Inquiries: blueprintresearch9@gmail.com
All indicators · CC BY-NC-SA 4.0 · Inquiries: blueprintresearch9@gmail.com
Clause de non-responsabilité
Les informations et publications ne sont pas destinées à être, et ne constituent pas, des conseils ou recommandations financiers, d'investissement, de trading ou autres fournis ou approuvés par TradingView. Pour en savoir plus, consultez les Conditions d'utilisation.