
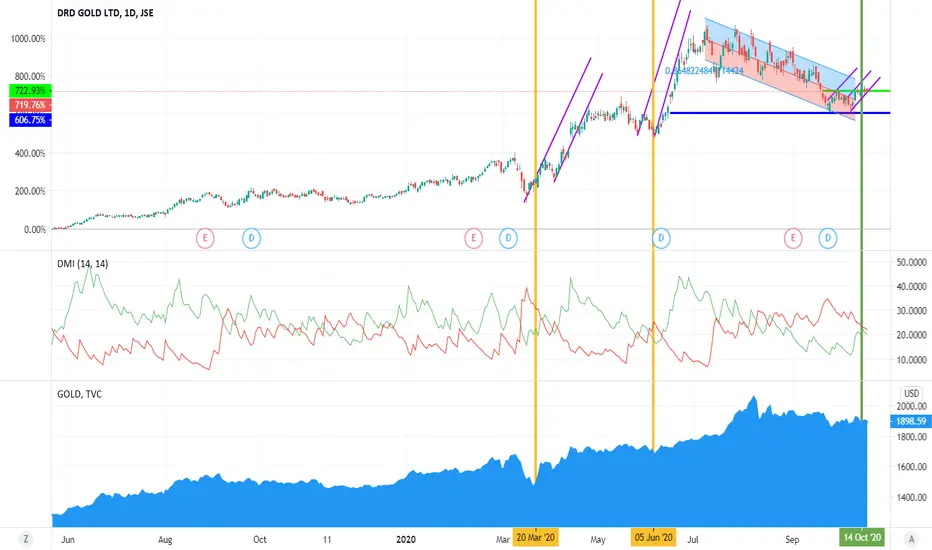
Yellow vertical lines indicates the changes in market movement when GOLD chart is at trough.
The parallel lines indicate a mock charge, after the market traders realize that GOLD is at a low, bullish action follows backed by the DT+ and DT- intercept of the DMI.
The above movement occurred twice, indicated with the 2 yellow vertical lines.
It is my view that such a third occurrence is possible, (green vertical line at current position) with low GOLD price, action to be confirmed with intercept of DMI.
DRD's balance sheet is in good shape and dividend payout shows promise.
Please leave comments below.
The parallel lines indicate a mock charge, after the market traders realize that GOLD is at a low, bullish action follows backed by the DT+ and DT- intercept of the DMI.
The above movement occurred twice, indicated with the 2 yellow vertical lines.
It is my view that such a third occurrence is possible, (green vertical line at current position) with low GOLD price, action to be confirmed with intercept of DMI.
DRD's balance sheet is in good shape and dividend payout shows promise.
Please leave comments below.

Clause de non-responsabilité
Les informations et publications ne sont pas destinées à être, et ne constituent pas, des conseils ou recommandations financiers, d'investissement, de trading ou autres fournis ou approuvés par TradingView. Pour en savoir plus, consultez les Conditions d'utilisation.
Clause de non-responsabilité
Les informations et publications ne sont pas destinées à être, et ne constituent pas, des conseils ou recommandations financiers, d'investissement, de trading ou autres fournis ou approuvés par TradingView. Pour en savoir plus, consultez les Conditions d'utilisation.