
🔍 Chart Overview
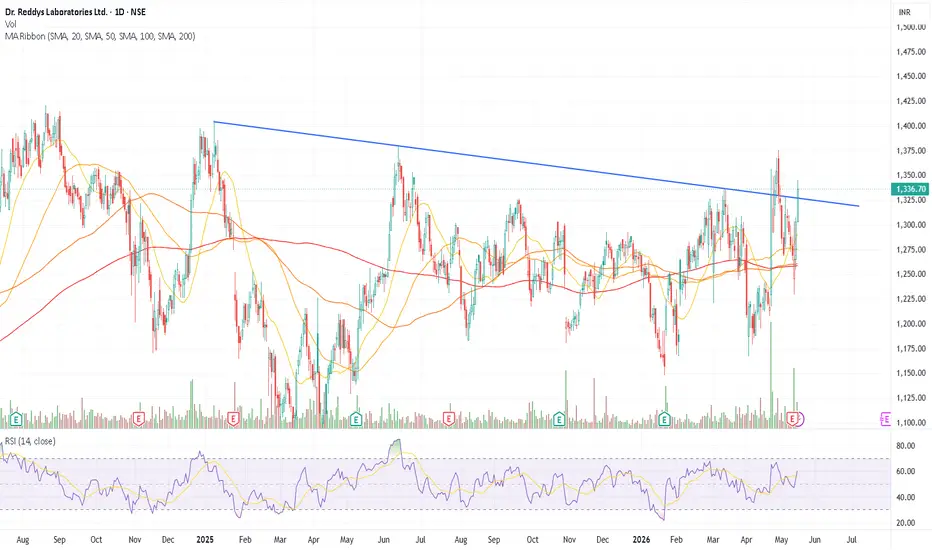
Dr. Reddy’s has been trading inside a broad consolidation range after a prolonged correction, while respecting a descending trendline from ~₹1,400 levels.
Price is now approaching a key resistance confluence near ₹1,330–₹1,350, making this a crucial breakout zone.
📈 Key Observations
✅ Descending Trendline Resistance
Multiple touches since early 2025
Current price (~₹1,336) sitting just below resistance
➡️ Breakout attempt in progress
✅ Range Structure
Price oscillating between ₹1,200 – ₹1,350
Current move is toward range high resistance
✅ Moving Average Alignment
Price above short-term MAs
Testing 100/200 SMA zone → key trend reversal signal if sustained
✅ RSI Strength
RSI ~60 → bullish momentum building
No overbought signal yet → room for upside
🚀 Trade Setup
✅ Bullish Breakout Setup
Entry: Above ₹1,350 (strong close + follow-through)
Targets: ₹1,400 / ₹1,450 / ₹1,500
Stop Loss: Below ₹1,280
❌ Rejection Scenario
Failure near resistance → continuation of range
Downside targets: ₹1,280 → ₹1,220
Dr. Reddy’s has been trading inside a broad consolidation range after a prolonged correction, while respecting a descending trendline from ~₹1,400 levels.
Price is now approaching a key resistance confluence near ₹1,330–₹1,350, making this a crucial breakout zone.
📈 Key Observations
✅ Descending Trendline Resistance
Multiple touches since early 2025
Current price (~₹1,336) sitting just below resistance
➡️ Breakout attempt in progress
✅ Range Structure
Price oscillating between ₹1,200 – ₹1,350
Current move is toward range high resistance
✅ Moving Average Alignment
Price above short-term MAs
Testing 100/200 SMA zone → key trend reversal signal if sustained
✅ RSI Strength
RSI ~60 → bullish momentum building
No overbought signal yet → room for upside
🚀 Trade Setup
✅ Bullish Breakout Setup
Entry: Above ₹1,350 (strong close + follow-through)
Targets: ₹1,400 / ₹1,450 / ₹1,500
Stop Loss: Below ₹1,280
❌ Rejection Scenario
Failure near resistance → continuation of range
Downside targets: ₹1,280 → ₹1,220
Trade fermée: ordre d’arrêt atteint

Clause de non-responsabilité
Les informations et publications ne sont pas destinées à être, et ne constituent pas, des conseils ou recommandations financiers, d'investissement, de trading ou autres fournis ou approuvés par TradingView. Pour en savoir plus, consultez les Conditions d'utilisation.
Clause de non-responsabilité
Les informations et publications ne sont pas destinées à être, et ne constituent pas, des conseils ou recommandations financiers, d'investissement, de trading ou autres fournis ou approuvés par TradingView. Pour en savoir plus, consultez les Conditions d'utilisation.