
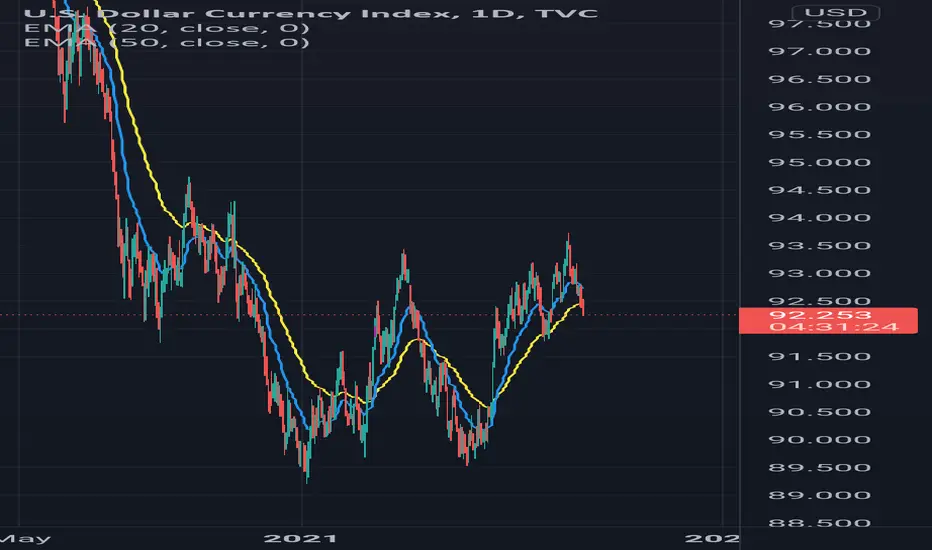
Time Frame: Daily candle
Indicators: 50 EMA
Line: Horizontal ( neck line)
Price Action is more accurate on big time frame. & Market always sustain around neck line. If it breaks with good strength we can see upside trend. So bullish on DXY.
Cadle is also taking support at 50 EMA.
Indicators: 50 EMA
Line: Horizontal ( neck line)
Price Action is more accurate on big time frame. & Market always sustain around neck line. If it breaks with good strength we can see upside trend. So bullish on DXY.
Cadle is also taking support at 50 EMA.

Clause de non-responsabilité
Les informations et publications ne sont pas destinées à être, et ne constituent pas, des conseils ou recommandations financiers, d'investissement, de trading ou autres fournis ou approuvés par TradingView. Pour en savoir plus, consultez les Conditions d'utilisation.
Clause de non-responsabilité
Les informations et publications ne sont pas destinées à être, et ne constituent pas, des conseils ou recommandations financiers, d'investissement, de trading ou autres fournis ou approuvés par TradingView. Pour en savoir plus, consultez les Conditions d'utilisation.