
"Super Swing Strategy" - Bollinger Bands, RSI, and ADX Strategy
Indicators Used:
- Bollinger Bands
- Relative Strength Index (RSI)
- Average Directional Index (ADX)
Bollinger Bands for volatility, RSI for overbought and oversold conditions, and ADX for strength of the trend.
How it Works:
Add Bollinger Bands, a 14-period RSI, and a 14-period ADX to your chart.
When the price touches the upper Bollinger Band, the RSI shows overbought conditions (above 70), and the ADX is above 20, it's a potential bearish signal.
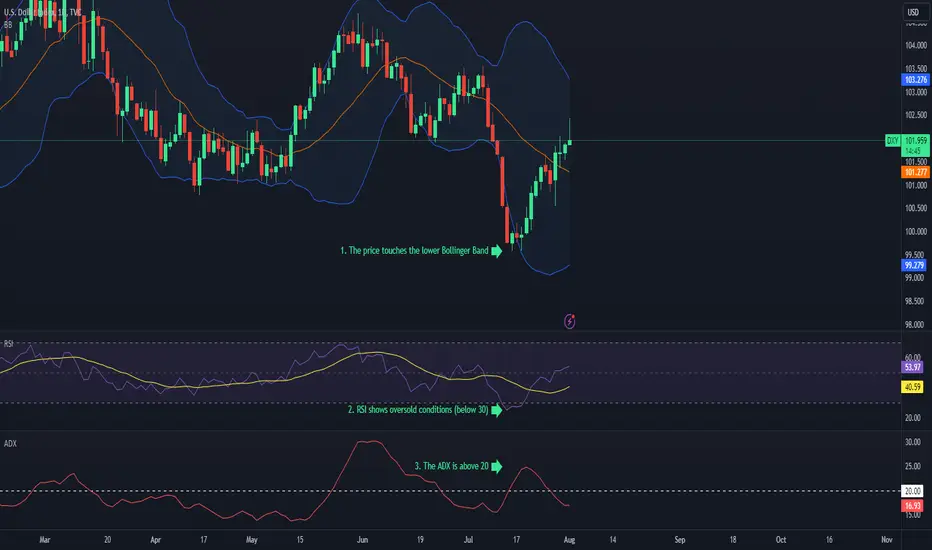
A bullish signal occurs when the price touches the lower Bollinger Band, the RSI shows oversold conditions (below 30), and the ADX is above 20.
You can use additional indicators or price action analysis to confirm signals.
Indicators Used:
- Bollinger Bands
- Relative Strength Index (RSI)
- Average Directional Index (ADX)
Bollinger Bands for volatility, RSI for overbought and oversold conditions, and ADX for strength of the trend.
How it Works:
Add Bollinger Bands, a 14-period RSI, and a 14-period ADX to your chart.
When the price touches the upper Bollinger Band, the RSI shows overbought conditions (above 70), and the ADX is above 20, it's a potential bearish signal.
A bullish signal occurs when the price touches the lower Bollinger Band, the RSI shows oversold conditions (below 30), and the ADX is above 20.
You can use additional indicators or price action analysis to confirm signals.

Clause de non-responsabilité
Les informations et publications ne sont pas destinées à être, et ne constituent pas, des conseils ou recommandations financiers, d'investissement, de trading ou autres fournis ou approuvés par TradingView. Pour en savoir plus, consultez les Conditions d'utilisation.
Clause de non-responsabilité
Les informations et publications ne sont pas destinées à être, et ne constituent pas, des conseils ou recommandations financiers, d'investissement, de trading ou autres fournis ou approuvés par TradingView. Pour en savoir plus, consultez les Conditions d'utilisation.