Long
EB - texbook chart
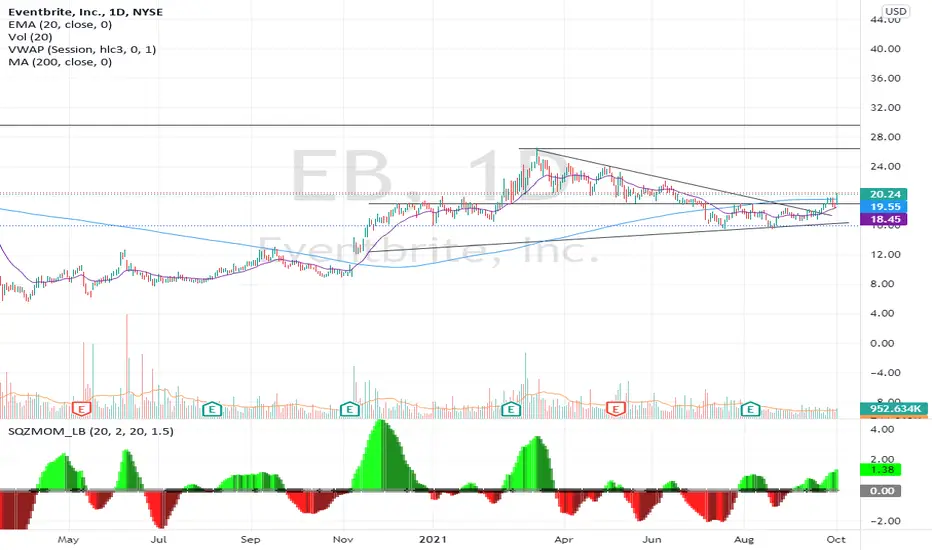
I went through a lot of charts this weekend. Most of them look choppy and ugly which is not surprising with this choppy market.
Picked this one which looks really healthy.
Just left the March-to-September downtrend, went above the strong level at 19.
Then made a healthy pull back, still hold arond the level. Yesterday - nice breakout.
MACD. RSI - positive
Weekly chart: breaking out from a wedge
Stop loss 18.40
Target 25
Picked this one which looks really healthy.
Just left the March-to-September downtrend, went above the strong level at 19.
Then made a healthy pull back, still hold arond the level. Yesterday - nice breakout.
MACD. RSI - positive
Weekly chart: breaking out from a wedge
Stop loss 18.40
Target 25

Clause de non-responsabilité
Les informations et publications ne sont pas destinées à être, et ne constituent pas, des conseils ou recommandations financiers, d'investissement, de trading ou autres fournis ou approuvés par TradingView. Pour en savoir plus, consultez les Conditions d'utilisation.
Clause de non-responsabilité
Les informations et publications ne sont pas destinées à être, et ne constituent pas, des conseils ou recommandations financiers, d'investissement, de trading ou autres fournis ou approuvés par TradingView. Pour en savoir plus, consultez les Conditions d'utilisation.