
Hello Crypto Lovers,
Mars Signals team wishes you high profits.
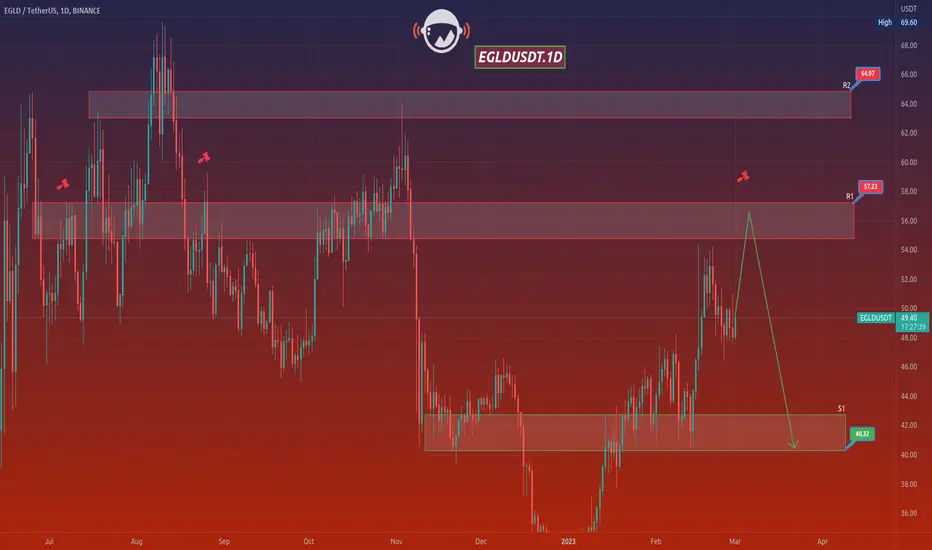
This is a one-day-time frame analysis for EGLDUSDT
There is R2 on the top of the chart which is a resistance area and it represents the unsuccessful triumphs of the price to rise at several points. R1 used to be a support area. And as you see, S1 is our support area with their well support of price for various points. Hence, we observe the fluctuation of price below R1 due to being rejection by the mentioned area. Our expectation would include another rise to reach R1 and then via having some rising signs, there would be more rise predicted for the price to reach higher amounts. Therefore, R1 is considered a good point for saving profits then. But it is so probable that the price loses the support at R1 and more decline would happen toward S1. Do not forget to consider the market situation in lower time frames and then decide what to do; based on the multiple pieces of information which you would obtain from our analyses and updates.
Warning: This is just a suggestion and we do not guarantee profits. We advise you to analyze the chart before opening any positions.
Wish you luck

Clause de non-responsabilité
Les informations et publications ne sont pas destinées à être, et ne constituent pas, des conseils ou recommandations financiers, d'investissement, de trading ou autres fournis ou approuvés par TradingView. Pour en savoir plus, consultez les Conditions d'utilisation.
Clause de non-responsabilité
Les informations et publications ne sont pas destinées à être, et ne constituent pas, des conseils ou recommandations financiers, d'investissement, de trading ou autres fournis ou approuvés par TradingView. Pour en savoir plus, consultez les Conditions d'utilisation.