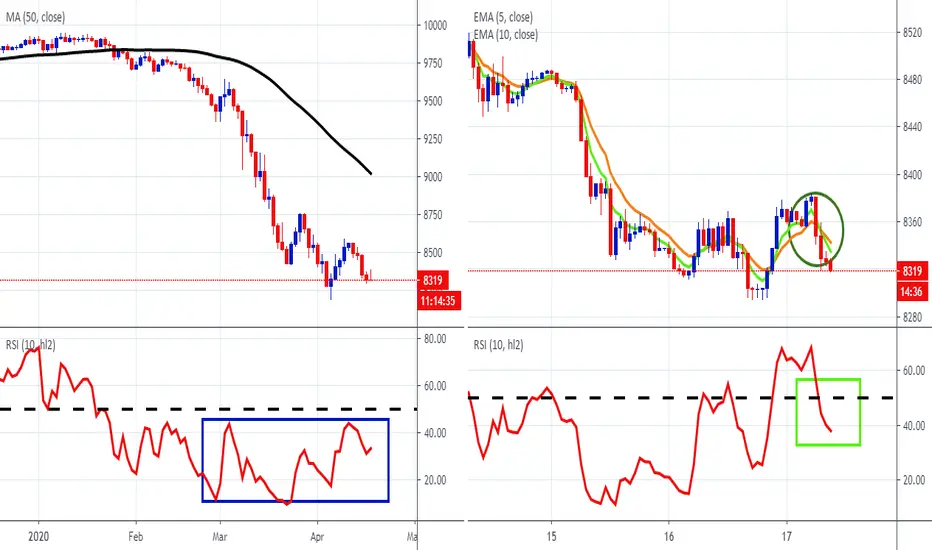
The left chart show's FXCM's emerging markets currency index, EMBASKET is black below its 50-day SMA. Moreover the SMA is pointing down with the RSI on the bearish side of 50 (blue rectangle). The right chart shows the hourly time frame. Here the green 5-hour EMA has crossed below the orange 10-hour EMA (green ellipse) and the RSI has moved below 50 (bright green rectangle). These are bearish developments and if the EMAs develop further angle and separation, the index will be showing further weak

Follow and Trade this analysis from your Charts. FXCM now Integrated with TradingView. Contact FXCM for more information.
Clause de non-responsabilité
Les informations et publications ne sont pas destinées à être, et ne constituent pas, des conseils ou recommandations financiers, d'investissement, de trading ou autres fournis ou approuvés par TradingView. Pour en savoir plus, consultez les Conditions d'utilisation.
Clause de non-responsabilité
Les informations et publications ne sont pas destinées à être, et ne constituent pas, des conseils ou recommandations financiers, d'investissement, de trading ou autres fournis ou approuvés par TradingView. Pour en savoir plus, consultez les Conditions d'utilisation.