
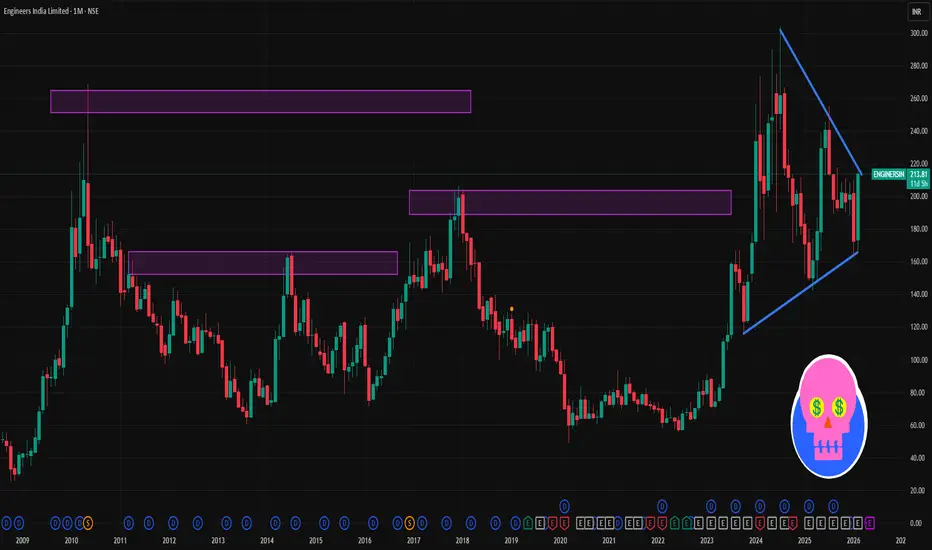
🟡 Current Price Context (as of mid-Feb 2026)
The stock has recently traded around ₹200–₹215 on NSE — a volatile move higher in the past few sessions.
📊 1-Month Support & Resistance Levels
(These are weekly-to-monthly pivot & technical levels to watch if you’re looking at a 1-month timeframe.)
🔼 Resistance Zones
~₹208 – ₹214: Near current short-term highs / recent pivot ~R1 zone.
₹215 – ₹221: Upper resistance cluster where price may see supply / reversal pressure.
~₹225 – ₹230+: Secondary resistance if trend accelerates.
🔽 Support Zones
~₹195 – ₹200: Immediate support / prior pivot area.
₹187 – ₹190: Mid-range support from recent moving averages & pivot structures.
₹180 – ₹185: Lower support zone, often seen as demand area in a pullback.
📉 Technical Indicators (Short-Term Bias)
Moving averages (like 20/50/100 DMA) often act as dynamic support/resistance — current data suggests 50-day/200-day near ₹180-₹190 (neutral to positive).
Momentum indicators like RSI can help confirm strength — if above 60 + rising, short-term bullish; if falling below ~50, risk of deeper pullback.
📌 Quick Summary (1-Month Frame)
Bullish breakout if price sustains above ~₹215-₹221 — could target higher resistance ~₹225-₹230.
Neutral / sideways near current levels (~₹200-₹208) — price may trade in that band.
Strong support ~₹180-₹195 — breakdown below this can signal deeper correction.
The stock has recently traded around ₹200–₹215 on NSE — a volatile move higher in the past few sessions.
📊 1-Month Support & Resistance Levels
(These are weekly-to-monthly pivot & technical levels to watch if you’re looking at a 1-month timeframe.)
🔼 Resistance Zones
~₹208 – ₹214: Near current short-term highs / recent pivot ~R1 zone.
₹215 – ₹221: Upper resistance cluster where price may see supply / reversal pressure.
~₹225 – ₹230+: Secondary resistance if trend accelerates.
🔽 Support Zones
~₹195 – ₹200: Immediate support / prior pivot area.
₹187 – ₹190: Mid-range support from recent moving averages & pivot structures.
₹180 – ₹185: Lower support zone, often seen as demand area in a pullback.
📉 Technical Indicators (Short-Term Bias)
Moving averages (like 20/50/100 DMA) often act as dynamic support/resistance — current data suggests 50-day/200-day near ₹180-₹190 (neutral to positive).
Momentum indicators like RSI can help confirm strength — if above 60 + rising, short-term bullish; if falling below ~50, risk of deeper pullback.
📌 Quick Summary (1-Month Frame)
Bullish breakout if price sustains above ~₹215-₹221 — could target higher resistance ~₹225-₹230.
Neutral / sideways near current levels (~₹200-₹208) — price may trade in that band.
Strong support ~₹180-₹195 — breakdown below this can signal deeper correction.

Contact Knowledgehub for a detailed consultation: Dm on WhatsApp: [wa.link/a2o0kz]-
Phone No: [+91 93102 26243]-
Email: [tradingviewknowledgehub@gmail.com]---
-- Let’s achieve success together!
Phone No: [+91 93102 26243]-
Email: [tradingviewknowledgehub@gmail.com]---
-- Let’s achieve success together!
Publications connexes
Clause de non-responsabilité
Les informations et publications ne sont pas destinées à être, et ne constituent pas, des conseils ou recommandations financiers, d'investissement, de trading ou autres fournis ou approuvés par TradingView. Pour en savoir plus, consultez les Conditions d'utilisation.
Contact Knowledgehub for a detailed consultation: Dm on WhatsApp: [wa.link/a2o0kz]-
Phone No: [+91 93102 26243]-
Email: [tradingviewknowledgehub@gmail.com]---
-- Let’s achieve success together!
Phone No: [+91 93102 26243]-
Email: [tradingviewknowledgehub@gmail.com]---
-- Let’s achieve success together!
Publications connexes
Clause de non-responsabilité
Les informations et publications ne sont pas destinées à être, et ne constituent pas, des conseils ou recommandations financiers, d'investissement, de trading ou autres fournis ou approuvés par TradingView. Pour en savoir plus, consultez les Conditions d'utilisation.