Long
EOS ANALYSIS
📊 #EOS Analysis
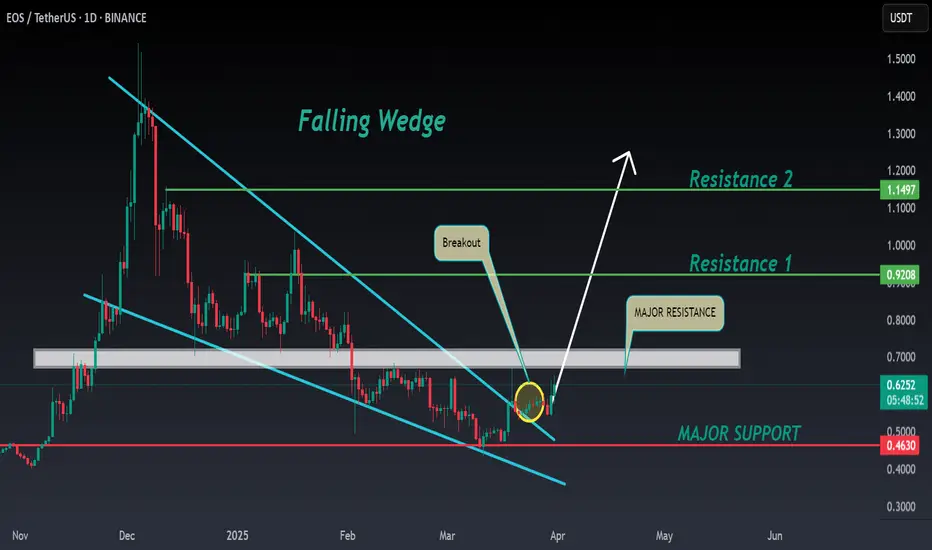
✅There is a formation of Falling Wedge Pattern on daily chart with a good breakout and currently retesting the major resistance zone🧐
Pattern signals potential bullish movement incoming after a breakout of major resistance zone
👀Current Price: $0.6235
🚀 Target Price: $0.9200
⚡️What to do ?
👀Keep an eye on #EOS price action and volume. We can trade according to the chart and make some profits⚡️⚡️
#EOS #Cryptocurrency #TechnicalAnalysis #DYOR
✅There is a formation of Falling Wedge Pattern on daily chart with a good breakout and currently retesting the major resistance zone🧐
Pattern signals potential bullish movement incoming after a breakout of major resistance zone
👀Current Price: $0.6235
🚀 Target Price: $0.9200
⚡️What to do ?
👀Keep an eye on #EOS price action and volume. We can trade according to the chart and make some profits⚡️⚡️
#EOS #Cryptocurrency #TechnicalAnalysis #DYOR

Become profitable trader!
Try our channels for Crypto Signals, Alerts and Secret Indicators
linktr.ee/zeus_market_alerts
Join our FREE Channel On Telegram linktr.ee/zeus_market_alerts
Try our channels for Crypto Signals, Alerts and Secret Indicators
linktr.ee/zeus_market_alerts
Join our FREE Channel On Telegram linktr.ee/zeus_market_alerts
Publications connexes
Clause de non-responsabilité
Les informations et publications ne sont pas destinées à être, et ne constituent pas, des conseils ou recommandations financiers, d'investissement, de trading ou autres fournis ou approuvés par TradingView. Pour en savoir plus, consultez les Conditions d'utilisation.
Become profitable trader!
Try our channels for Crypto Signals, Alerts and Secret Indicators
linktr.ee/zeus_market_alerts
Join our FREE Channel On Telegram linktr.ee/zeus_market_alerts
Try our channels for Crypto Signals, Alerts and Secret Indicators
linktr.ee/zeus_market_alerts
Join our FREE Channel On Telegram linktr.ee/zeus_market_alerts
Publications connexes
Clause de non-responsabilité
Les informations et publications ne sont pas destinées à être, et ne constituent pas, des conseils ou recommandations financiers, d'investissement, de trading ou autres fournis ou approuvés par TradingView. Pour en savoir plus, consultez les Conditions d'utilisation.