Long
EOSUSDT
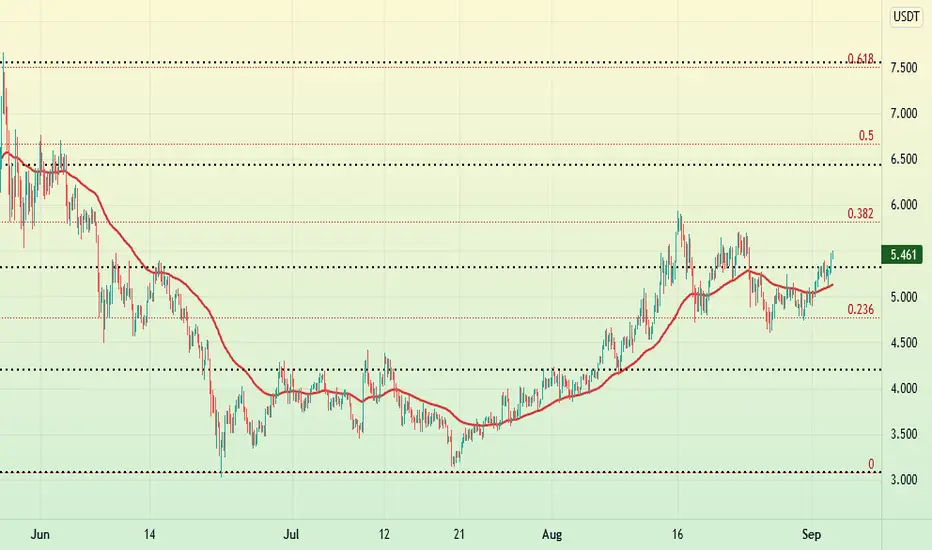
Look at black dotted lines on my chart...
They are support & resistance for moving average thats mean when MA cross above or below this lines,Price starting to Reaction
For example On EOS 4H chart when MA cross above 5.31 line, price will go to the next resistance on 6.4 & 7.5
Crossing MA on upper time frame like Daily, Weekly , ... will be bigger but i prefer to work on 4H time frame

Clause de non-responsabilité
Les informations et publications ne sont pas destinées à être, et ne constituent pas, des conseils ou recommandations financiers, d'investissement, de trading ou autres fournis ou approuvés par TradingView. Pour en savoir plus, consultez les Conditions d'utilisation.
Clause de non-responsabilité
Les informations et publications ne sont pas destinées à être, et ne constituent pas, des conseils ou recommandations financiers, d'investissement, de trading ou autres fournis ou approuvés par TradingView. Pour en savoir plus, consultez les Conditions d'utilisation.