
ES1! Extreme acceleration at resistance. Which way does this go?
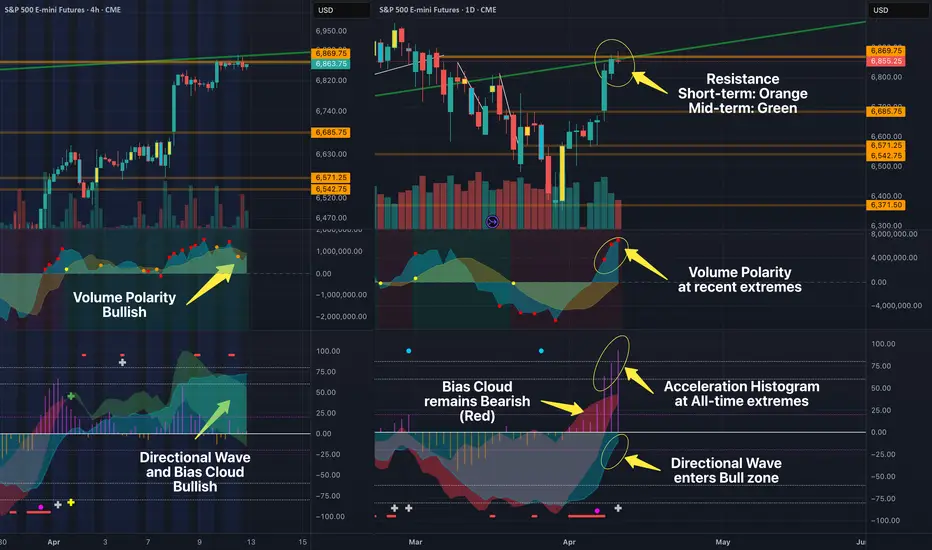
The 4H is fully bullish. Volume Polarity surging, Bias Cloud green, Directional Wave expanding. On the surface this looks like a market with legs.
Zoom out and it gets complicated.
The Daily Bias Cloud is still red, threatening to flip but not there yet. The Directional Wave has entered the Bull Zone and the Acceleration Histogram is at a level I've only seen twice before on this chart, June 2006 and September 2007.
The June 2006 reading led to a quick dump and then a decent run before the eventual top. The September 2007 reading came almost exactly one month before the initial dump that became the 2008 Financial Crisis.
I'm not calling a crash. One data point doesn't make a thesis. But extreme acceleration at resistance is rarely the launching pad for a sustained move higher. Right now we're sitting directly under short-term (orange) resistance at $6,869 and mid-term (green) resistance that dates back to the breakout in June 2025.
To make things messier, the Weekly just flipped its Bias Cloud to Bearish.
To me this looks like a relief rally running out of steam. I'd expect a rejection off the $6,869 level down to the resistance turned support at $6,685.
Break and hold above $6,869 and I'm wrong.
Zoom out and it gets complicated.
The Daily Bias Cloud is still red, threatening to flip but not there yet. The Directional Wave has entered the Bull Zone and the Acceleration Histogram is at a level I've only seen twice before on this chart, June 2006 and September 2007.
The June 2006 reading led to a quick dump and then a decent run before the eventual top. The September 2007 reading came almost exactly one month before the initial dump that became the 2008 Financial Crisis.
I'm not calling a crash. One data point doesn't make a thesis. But extreme acceleration at resistance is rarely the launching pad for a sustained move higher. Right now we're sitting directly under short-term (orange) resistance at $6,869 and mid-term (green) resistance that dates back to the breakout in June 2025.
To make things messier, the Weekly just flipped its Bias Cloud to Bearish.
To me this looks like a relief rally running out of steam. I'd expect a rejection off the $6,869 level down to the resistance turned support at $6,685.
Break and hold above $6,869 and I'm wrong.

Publications connexes
Clause de non-responsabilité
Les informations et publications ne sont pas destinées à être, et ne constituent pas, des conseils ou recommandations financiers, d'investissement, de trading ou autres fournis ou approuvés par TradingView. Pour en savoir plus, consultez les Conditions d'utilisation.
Publications connexes
Clause de non-responsabilité
Les informations et publications ne sont pas destinées à être, et ne constituent pas, des conseils ou recommandations financiers, d'investissement, de trading ou autres fournis ou approuvés par TradingView. Pour en savoir plus, consultez les Conditions d'utilisation.