
TLDR:
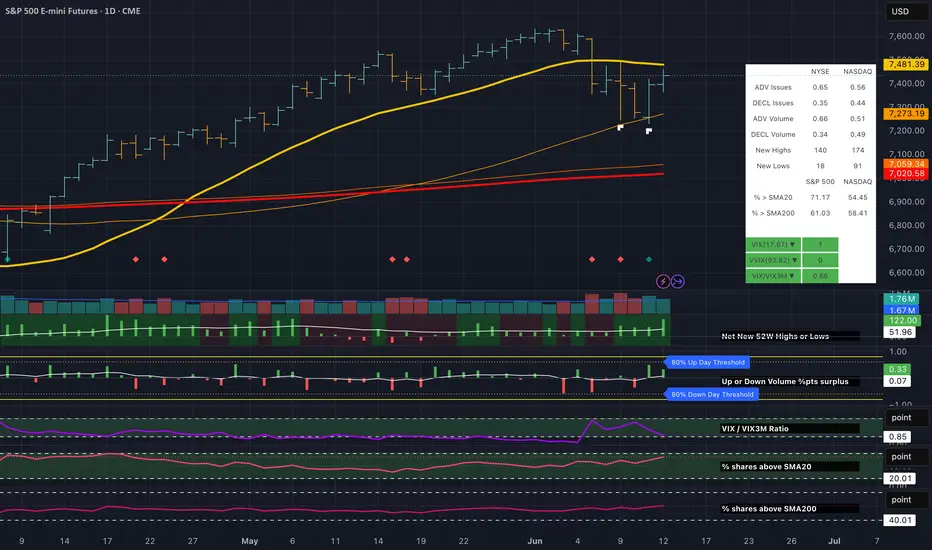
The most important message from the dashboard is that internals improved faster than price. Leadership expanded, participation recovered and volatility normalized while price remains below recent highs. That combination suggests the market's internal condition is currently stronger than the recent price action alone would imply. The evidence therefore supports a regime of Acceptance with Renewed Participation, where market internals are once again confirming rather than questioning the message of price.
1️⃣ What do we see?
A week ago, the dashboard was raising legitimate questions about participation, leadership and volatility pressure.
Today, the picture looks very different.
The most important observation is not that price bounced. It is that the internal market structure improved significantly.
* VIX/VIX3M fell back to 0.86, indicating volatility normalization.
* S&P 500 stocks above SMA20 rose to 71%.
* S&P 500 stocks above SMA200 increased to 61%.
* NYSE New Highs expanded to 140 versus only 18 New Lows.
* NASDAQ New Highs expanded to 174 versus 91 New Lows.
* Advancing issues and advancing volume regained dominance across both exchanges.
Participation, leadership and breadth all improved simultaneously.
That combination is difficult to dismiss as a simple short-covering rally.
⸻
2️⃣ Thesis
The dashboard currently supports a view of Acceptance with Renewed Participation.
The recent selloff appears increasingly consistent with a rotation-induced shakeout rather than the beginning of a broad deterioration phase.
Leadership is expanding again.
Participation is broadening again.
Volatility pressure is easing again.
The market is not simply rising. The internal engine generating price has improved.
⸻
3️⃣ What validates the thesis?
The thesis remains valid if:
* VIX/VIX3M remains below 1.0 and continues normalizing.
* New Highs continue expanding relative to New Lows.
* % of stocks above SMA20 remains elevated or improves.
* % of stocks above SMA200 remains stable or trends higher.
* Advancing volume continues confirming price strength.
* Leadership remains broad across sectors rather than concentrated in a handful of names.
In that environment, internals continue confirming price.
⸻
4️⃣ What invalidates the thesis?
The thesis is invalidated if:
* VIX/VIX3M moves back toward or above 1.0.
* New Lows begin expanding materially.
* Leadership narrows again.
* % Above SMA20 rolls over sharply.
* Breadth weakens while price continues advancing.
That would indicate the recent improvement was temporary and that internal deterioration is re-emerging beneath the surface.
⸻
Why This Dashboard Matters
1. Reduction of Uncertainty / Confusion
Most market participants focus on the index and ask:
“Was the selloff meaningful?”
This dashboard asks a more useful question:
“Did market internals improve or deteriorate?”
Only a week ago, volatility pressure was rising, leadership was weakening and participation was becoming more selective. Today, those same indicators have improved materially. The framework allows us to observe that shift objectively rather than relying on opinions or emotions.
Instead of predicting the future, we measure whether the weight of evidence is strengthening or weakening.
I don’t need to know the future; I need to assess whether evidence is improving.
⸻
2. Reduction of Effort
Without a framework, every market move feels different.
With this dashboard, we repeatedly examine the same recurring conditions:
* Volatility
* Participation
* Leadership
* Breadth
* Volume confirmation
This week we did not need hundreds of charts to understand the market. By monitoring VIX/VIX3M, New Highs versus New Lows, % Above SMA20, % Above SMA200 and Up/Down Volume, the market’s internal condition became clear.
The framework converts complexity into a small number of repeatable observations.
I don’t need to analyze everything; I need to recognize a handful of recurring conditions.
⸻
3. Identity Reinforcement
The objective is not to predict whether the market will be higher or lower next week.
The objective is to follow evidence.
A week ago, the dashboard suggested caution because participation was weakening and volatility pressure was rising. Today, the same framework identifies improving breadth, expanding leadership and normalized volatility.
The process did not change.
The evidence changed.
That is how disciplined investors operate. They adapt when evidence changes rather than defend opinions.
I am a process-driven investor, not a prediction-driven investor.
The most important message from the dashboard is that internals improved faster than price. Leadership expanded, participation recovered and volatility normalized while price remains below recent highs. That combination suggests the market's internal condition is currently stronger than the recent price action alone would imply. The evidence therefore supports a regime of Acceptance with Renewed Participation, where market internals are once again confirming rather than questioning the message of price.
1️⃣ What do we see?
A week ago, the dashboard was raising legitimate questions about participation, leadership and volatility pressure.
Today, the picture looks very different.
The most important observation is not that price bounced. It is that the internal market structure improved significantly.
* VIX/VIX3M fell back to 0.86, indicating volatility normalization.
* S&P 500 stocks above SMA20 rose to 71%.
* S&P 500 stocks above SMA200 increased to 61%.
* NYSE New Highs expanded to 140 versus only 18 New Lows.
* NASDAQ New Highs expanded to 174 versus 91 New Lows.
* Advancing issues and advancing volume regained dominance across both exchanges.
Participation, leadership and breadth all improved simultaneously.
That combination is difficult to dismiss as a simple short-covering rally.
⸻
2️⃣ Thesis
The dashboard currently supports a view of Acceptance with Renewed Participation.
The recent selloff appears increasingly consistent with a rotation-induced shakeout rather than the beginning of a broad deterioration phase.
Leadership is expanding again.
Participation is broadening again.
Volatility pressure is easing again.
The market is not simply rising. The internal engine generating price has improved.
⸻
3️⃣ What validates the thesis?
The thesis remains valid if:
* VIX/VIX3M remains below 1.0 and continues normalizing.
* New Highs continue expanding relative to New Lows.
* % of stocks above SMA20 remains elevated or improves.
* % of stocks above SMA200 remains stable or trends higher.
* Advancing volume continues confirming price strength.
* Leadership remains broad across sectors rather than concentrated in a handful of names.
In that environment, internals continue confirming price.
⸻
4️⃣ What invalidates the thesis?
The thesis is invalidated if:
* VIX/VIX3M moves back toward or above 1.0.
* New Lows begin expanding materially.
* Leadership narrows again.
* % Above SMA20 rolls over sharply.
* Breadth weakens while price continues advancing.
That would indicate the recent improvement was temporary and that internal deterioration is re-emerging beneath the surface.
⸻
Why This Dashboard Matters
1. Reduction of Uncertainty / Confusion
Most market participants focus on the index and ask:
“Was the selloff meaningful?”
This dashboard asks a more useful question:
“Did market internals improve or deteriorate?”
Only a week ago, volatility pressure was rising, leadership was weakening and participation was becoming more selective. Today, those same indicators have improved materially. The framework allows us to observe that shift objectively rather than relying on opinions or emotions.
Instead of predicting the future, we measure whether the weight of evidence is strengthening or weakening.
I don’t need to know the future; I need to assess whether evidence is improving.
⸻
2. Reduction of Effort
Without a framework, every market move feels different.
With this dashboard, we repeatedly examine the same recurring conditions:
* Volatility
* Participation
* Leadership
* Breadth
* Volume confirmation
This week we did not need hundreds of charts to understand the market. By monitoring VIX/VIX3M, New Highs versus New Lows, % Above SMA20, % Above SMA200 and Up/Down Volume, the market’s internal condition became clear.
The framework converts complexity into a small number of repeatable observations.
I don’t need to analyze everything; I need to recognize a handful of recurring conditions.
⸻
3. Identity Reinforcement
The objective is not to predict whether the market will be higher or lower next week.
The objective is to follow evidence.
A week ago, the dashboard suggested caution because participation was weakening and volatility pressure was rising. Today, the same framework identifies improving breadth, expanding leadership and normalized volatility.
The process did not change.
The evidence changed.
That is how disciplined investors operate. They adapt when evidence changes rather than defend opinions.
I am a process-driven investor, not a prediction-driven investor.
Note
The recent weakness looks increasingly like a rotation event that punished concentrated momentum exposure rather than a genuine deterioration in overall market health.The recovery in market internals is not being driven by a single leadership group. Technology remains the dominant long-term leader, but Financials, Industrials, Real Estate and Healthcare are now contributing to participation as well. This broadening of leadership helps explain why New Highs expanded dramatically and why breadth recovered faster than price. The current environment appears less like a narrow AI-driven advance and more like a market where participation is becoming increasingly diversified.
The Market Didn’t Break. It diversified.
That’s why the dashboard looked healthy while (AI/Chip) momentum portfolios struggled.
Technology: Established leadership still intact
Industrials: Strong secondary leadership, confirming economic participation
Financials: Emerging leadership, strongest recent improvement
Real Estate: Improving participation, risk appetite broadening
Healthcare: Early repair phase rather than true leadership
Technology remains:
* 3M: +27.13%
* 6M: +16.76%
* 1Y: +43.07%
* YTD: +20.61%
Financials improved:
* 3M: +11.46%
* 6M: +2.15%
* 1Y: +12.83%
* YTD: +0.61%
Industrials improved:
* 3M: +9.17%
* 6M: +15.36%
* 1Y: +26.82%
* YTD: +16.12%
Real Estate improved:
* 3M: +6.94%
* 6M: +9.85%
* 1Y: +8.36%
* YTD: +10.69%
Healthcare improved:
* 3M: +3.22%
* 6M: +0.80%
* 1Y: +13.33%
* YTD: -0.59%

You don’t have an information problem. You have a decision problem. TradeSentinel helps to fix it.
📈 Custom Indicators
𝕏 More insights, guidance & links
🤖 AI features via 𝕏 and ChatGPT
🤑 Founding Member Price
🌐 tradesentinel.app
❗ Boost/comment
📈 Custom Indicators
𝕏 More insights, guidance & links
🤖 AI features via 𝕏 and ChatGPT
🤑 Founding Member Price
🌐 tradesentinel.app
❗ Boost/comment
Publications connexes
Clause de non-responsabilité
Les informations et publications ne sont pas destinées à être, et ne constituent pas, des conseils ou recommandations financiers, d'investissement, de trading ou autres fournis ou approuvés par TradingView. Pour en savoir plus, consultez les Conditions d'utilisation.
You don’t have an information problem. You have a decision problem. TradeSentinel helps to fix it.
📈 Custom Indicators
𝕏 More insights, guidance & links
🤖 AI features via 𝕏 and ChatGPT
🤑 Founding Member Price
🌐 tradesentinel.app
❗ Boost/comment
📈 Custom Indicators
𝕏 More insights, guidance & links
🤖 AI features via 𝕏 and ChatGPT
🤑 Founding Member Price
🌐 tradesentinel.app
❗ Boost/comment
Publications connexes
Clause de non-responsabilité
Les informations et publications ne sont pas destinées à être, et ne constituent pas, des conseils ou recommandations financiers, d'investissement, de trading ou autres fournis ou approuvés par TradingView. Pour en savoir plus, consultez les Conditions d'utilisation.