
Medium Term Path with More Probabilities for S&P 500 Daily Chart
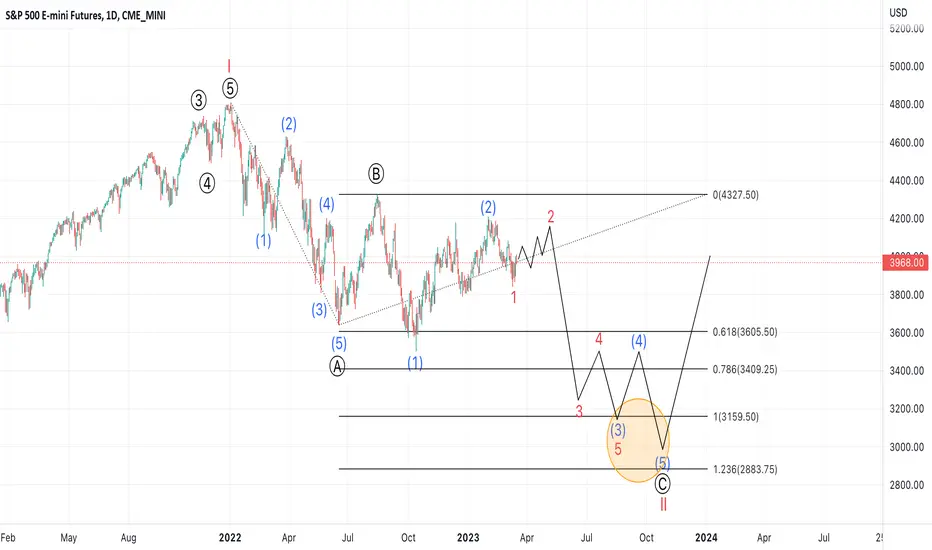
Short and Medium term structure S&P is bearish once it makes a new low around 3,500. Now we expects more downside to 3,100 as it's shown in the orange circle in Daily Chart. We expects a reverse in this circle area and we saw a strong correlation with other indices (American, European and Asian). Next week, we'll update this forecast.

✅ Get trading news and learn about amazing trading strategies, tools and education
✅ iOS App: itunes.apple.com/app/id6471829868
✅ Android App: play.google.com/store/apps/details?id=com.marketrightside.marketrightside
✅ iOS App: itunes.apple.com/app/id6471829868
✅ Android App: play.google.com/store/apps/details?id=com.marketrightside.marketrightside
Clause de non-responsabilité
Les informations et publications ne sont pas destinées à être, et ne constituent pas, des conseils ou recommandations financiers, d'investissement, de trading ou autres fournis ou approuvés par TradingView. Pour en savoir plus, consultez les Conditions d'utilisation.
✅ Get trading news and learn about amazing trading strategies, tools and education
✅ iOS App: itunes.apple.com/app/id6471829868
✅ Android App: play.google.com/store/apps/details?id=com.marketrightside.marketrightside
✅ iOS App: itunes.apple.com/app/id6471829868
✅ Android App: play.google.com/store/apps/details?id=com.marketrightside.marketrightside
Clause de non-responsabilité
Les informations et publications ne sont pas destinées à être, et ne constituent pas, des conseils ou recommandations financiers, d'investissement, de trading ou autres fournis ou approuvés par TradingView. Pour en savoir plus, consultez les Conditions d'utilisation.