
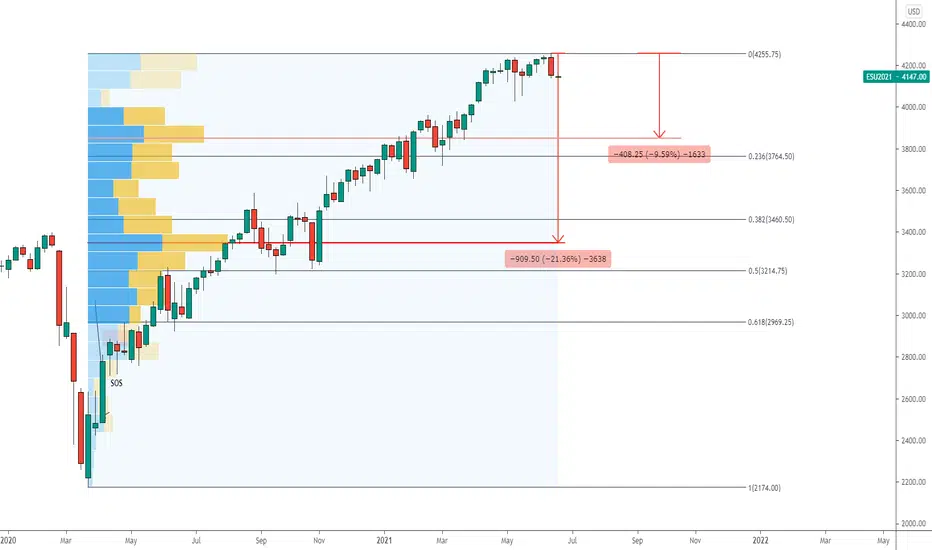
After a strong sell off -59pts or -1.39% (supply) for S&P 500 on last Friday, 18 June 2021, this is a potential start of a market correction.
Here are 2 key support levels to mark on the charts if index continues to fall.
1st Level: 3,850
High Volume Area
Fibo Retracement of 23.6%
10% fall from Peak
2nd Level: 3,400
High Volume Area
Fibo Retracement of 38.2%
20% fall from Peak
Here are 2 key support levels to mark on the charts if index continues to fall.
1st Level: 3,850
High Volume Area
Fibo Retracement of 23.6%
10% fall from Peak
2nd Level: 3,400
High Volume Area
Fibo Retracement of 38.2%
20% fall from Peak

Clause de non-responsabilité
Les informations et publications ne sont pas destinées à être, et ne constituent pas, des conseils ou recommandations financiers, d'investissement, de trading ou autres fournis ou approuvés par TradingView. Pour en savoir plus, consultez les Conditions d'utilisation.
Clause de non-responsabilité
Les informations et publications ne sont pas destinées à être, et ne constituent pas, des conseils ou recommandations financiers, d'investissement, de trading ou autres fournis ou approuvés par TradingView. Pour en savoir plus, consultez les Conditions d'utilisation.