
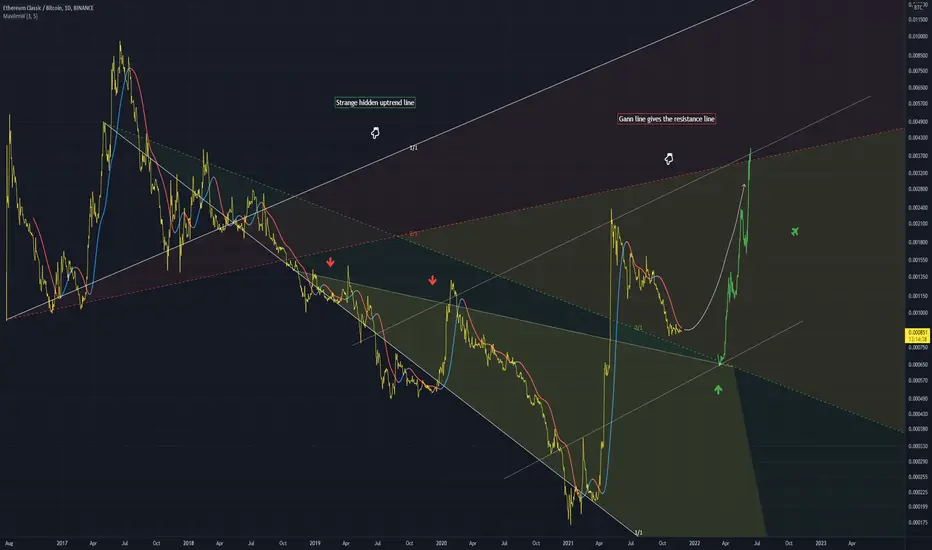
Using the Gann tool we can plot down trends and uptrends
Plotting both, it gives a support point for price, and also a resistance point
I expect a bounce off the support from the downtrend Gann line at some point
This bounce will hit the resistance Gann line (in red)
A large up channel can also be plotted if you place this up move (dotted line)
The indicator is what I expect will occur as price moves (in white)

Clause de non-responsabilité
Les informations et publications ne sont pas destinées à être, et ne constituent pas, des conseils ou recommandations financiers, d'investissement, de trading ou autres fournis ou approuvés par TradingView. Pour en savoir plus, consultez les Conditions d'utilisation.
Clause de non-responsabilité
Les informations et publications ne sont pas destinées à être, et ne constituent pas, des conseils ou recommandations financiers, d'investissement, de trading ou autres fournis ou approuvés par TradingView. Pour en savoir plus, consultez les Conditions d'utilisation.