
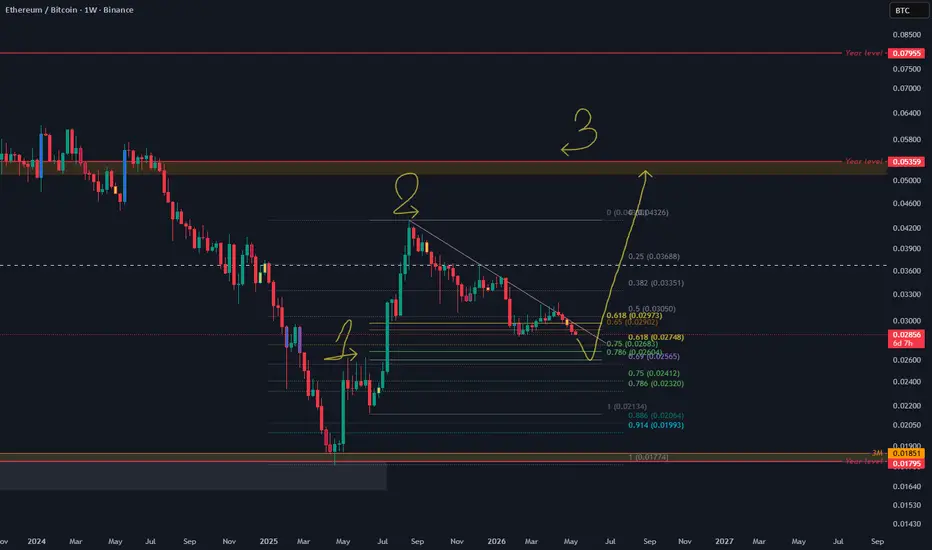
We’re deep in a multi-month corrective phase after the big 2024–2025 move. Price has been grinding inside a descending channel, respecting Fibonacci retracement levels perfectly.
Clear 3-wave corrective structure so far (labeled 1-2-3 on the chart)
Holding above the 0.786 Fib and the long-term yearly support zone (~0.028)
Multiple confluences pointing to a major turning point
I believe we’re in the final stages of this correction and preparing for Wave 3 — the strongest impulsive leg higher.
A clean breakout above the descending trendline and the 0.5–0.618 Fib zone (0.030–0.035) should trigger serious buying pressure on ETH and kick off the real Altseason we’ve all been waiting for.
Clear 3-wave corrective structure so far (labeled 1-2-3 on the chart)
Holding above the 0.786 Fib and the long-term yearly support zone (~0.028)
Multiple confluences pointing to a major turning point
I believe we’re in the final stages of this correction and preparing for Wave 3 — the strongest impulsive leg higher.
A clean breakout above the descending trendline and the 0.5–0.618 Fib zone (0.030–0.035) should trigger serious buying pressure on ETH and kick off the real Altseason we’ve all been waiting for.

Clause de non-responsabilité
Les informations et publications ne sont pas destinées à être, et ne constituent pas, des conseils ou recommandations financiers, d'investissement, de trading ou autres fournis ou approuvés par TradingView. Pour en savoir plus, consultez les Conditions d'utilisation.
Clause de non-responsabilité
Les informations et publications ne sont pas destinées à être, et ne constituent pas, des conseils ou recommandations financiers, d'investissement, de trading ou autres fournis ou approuvés par TradingView. Pour en savoir plus, consultez les Conditions d'utilisation.