Long
ETHO analysis with buy setup
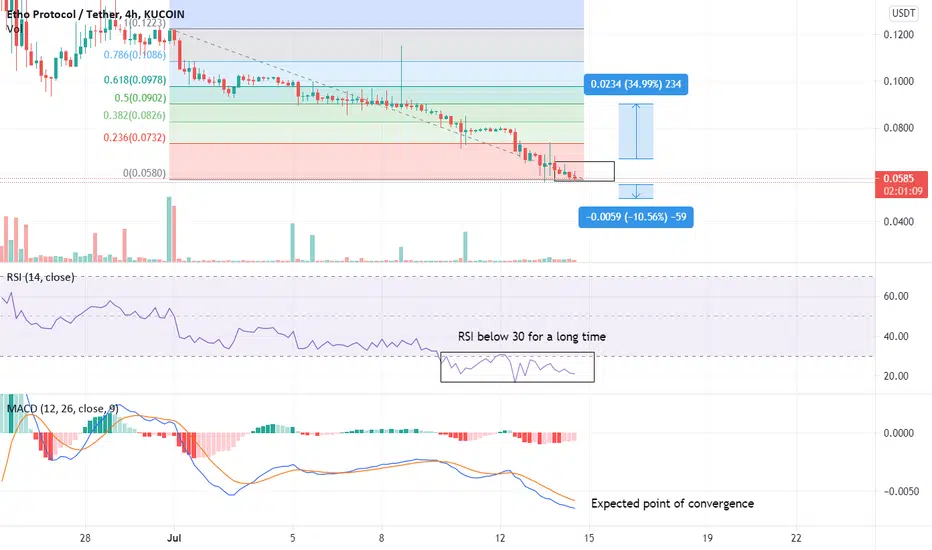
ETHO chart gives us data of future growth. This is supported by several things. Firstly, RSI below 30 point for a long while. Secondly, point of convergence for MACD. Thirdly, decreasing MACD wave. Based on that positive data we can create buy setup like this:
Buy Price: 0.0580-0.0610
TP: 0.0902
SL: 0.0500
Buy Price: 0.0580-0.0610
TP: 0.0902
SL: 0.0500

Clause de non-responsabilité
Les informations et publications ne sont pas destinées à être, et ne constituent pas, des conseils ou recommandations financiers, d'investissement, de trading ou autres fournis ou approuvés par TradingView. Pour en savoir plus, consultez les Conditions d'utilisation.
Clause de non-responsabilité
Les informations et publications ne sont pas destinées à être, et ne constituent pas, des conseils ou recommandations financiers, d'investissement, de trading ou autres fournis ou approuvés par TradingView. Pour en savoir plus, consultez les Conditions d'utilisation.