
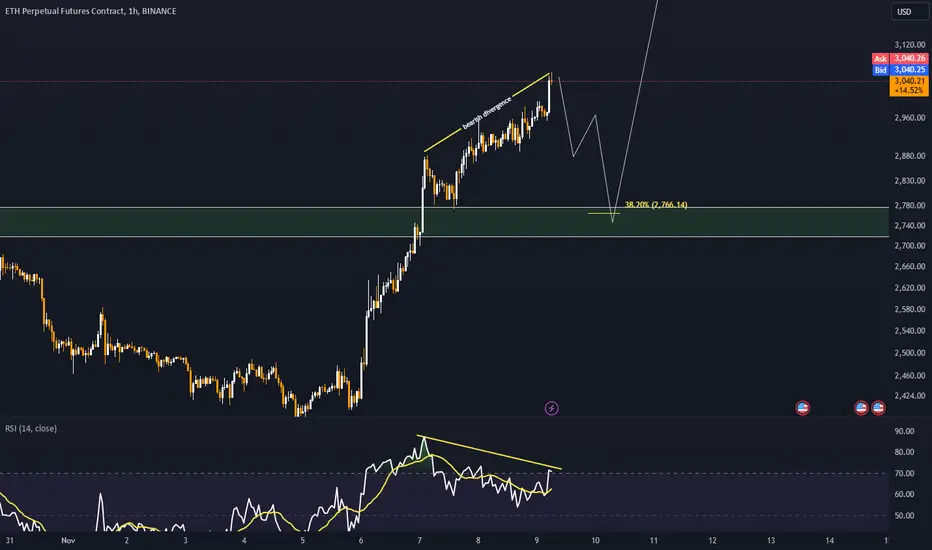
Ethereum is currently displaying signs of a bearish divergence on lower timeframes, a signal that often indicates a potential slowdown in upward momentum and the likelihood of a correction. Despite the bearish signal, the ongoing correction appears to be relatively shallow, suggesting that the underlying bullish structure remains intact.
A retracement to the 0.382 Fibonacci level could present an attractive buying opportunity for traders looking to enter at a lower risk point. This level is often viewed as a key zone for price reactions during corrections, providing a favorable balance between value and momentum for long-term positions.
A retracement to the 0.382 Fibonacci level could present an attractive buying opportunity for traders looking to enter at a lower risk point. This level is often viewed as a key zone for price reactions during corrections, providing a favorable balance between value and momentum for long-term positions.

Clause de non-responsabilité
Les informations et publications ne sont pas destinées à être, et ne constituent pas, des conseils ou recommandations financiers, d'investissement, de trading ou autres fournis ou approuvés par TradingView. Pour en savoir plus, consultez les Conditions d'utilisation.
Clause de non-responsabilité
Les informations et publications ne sont pas destinées à être, et ne constituent pas, des conseils ou recommandations financiers, d'investissement, de trading ou autres fournis ou approuvés par TradingView. Pour en savoir plus, consultez les Conditions d'utilisation.