
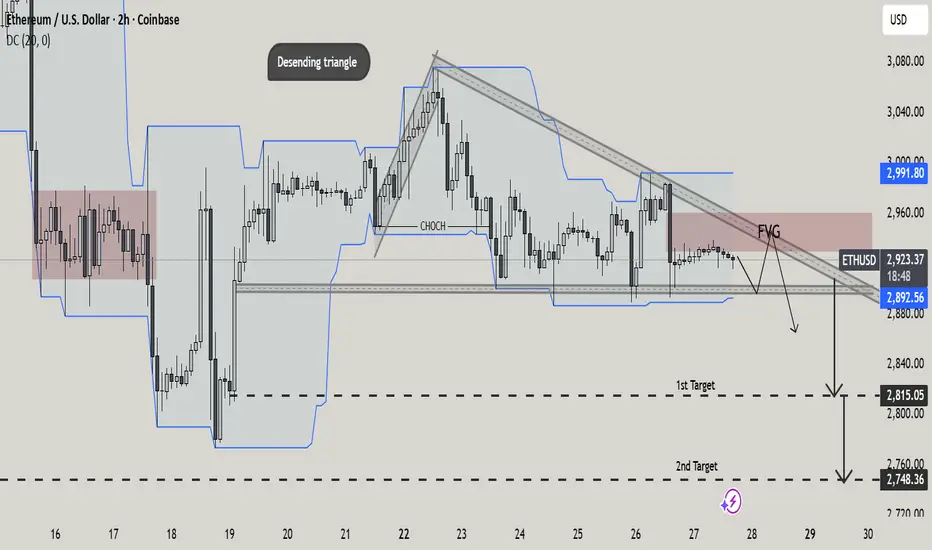
This 2H ETH/USD chart highlights a descending triangle structure forming after a prior impulse move. Price is consistently making lower highs beneath a descending trendline, while holding a horizontal support zone around 2,890–2,900, signaling growing bearish pressure.
A clear CHoCH (Change of Character) confirms the shift in market structure from bullish to bearish. Price is currently trading below key dynamic resistance and within a marked Fair Value Gap (FVG), suggesting a potential rejection area before continuation lower.
The projected downside targets are:
1st Target: ~2,815 (liquidity sweep / prior support)
2nd Target: ~2,748 (major demand zone)
Overall, the chart presents a classic bearish continuation setup, favoring downside expansion if support breaks with confirmation.
A clear CHoCH (Change of Character) confirms the shift in market structure from bullish to bearish. Price is currently trading below key dynamic resistance and within a marked Fair Value Gap (FVG), suggesting a potential rejection area before continuation lower.
The projected downside targets are:
1st Target: ~2,815 (liquidity sweep / prior support)
2nd Target: ~2,748 (major demand zone)
Overall, the chart presents a classic bearish continuation setup, favoring downside expansion if support breaks with confirmation.

telegram channel link
t.me/+4HnhYAZNJ-lhNmY0
join to get daily basis 2-3 free signal for educational purpose
t.me/+4HnhYAZNJ-lhNmY0
you tube channel for trading education
youtube.com/@ALPHA_TRADE_SCOPE
t.me/+4HnhYAZNJ-lhNmY0
join to get daily basis 2-3 free signal for educational purpose
t.me/+4HnhYAZNJ-lhNmY0
you tube channel for trading education
youtube.com/@ALPHA_TRADE_SCOPE
Publications connexes
Clause de non-responsabilité
Les informations et publications ne sont pas destinées à être, et ne constituent pas, des conseils ou recommandations financiers, d'investissement, de trading ou autres fournis ou approuvés par TradingView. Pour en savoir plus, consultez les Conditions d'utilisation.
telegram channel link
t.me/+4HnhYAZNJ-lhNmY0
join to get daily basis 2-3 free signal for educational purpose
t.me/+4HnhYAZNJ-lhNmY0
you tube channel for trading education
youtube.com/@ALPHA_TRADE_SCOPE
t.me/+4HnhYAZNJ-lhNmY0
join to get daily basis 2-3 free signal for educational purpose
t.me/+4HnhYAZNJ-lhNmY0
you tube channel for trading education
youtube.com/@ALPHA_TRADE_SCOPE
Publications connexes
Clause de non-responsabilité
Les informations et publications ne sont pas destinées à être, et ne constituent pas, des conseils ou recommandations financiers, d'investissement, de trading ou autres fournis ou approuvés par TradingView. Pour en savoir plus, consultez les Conditions d'utilisation.