
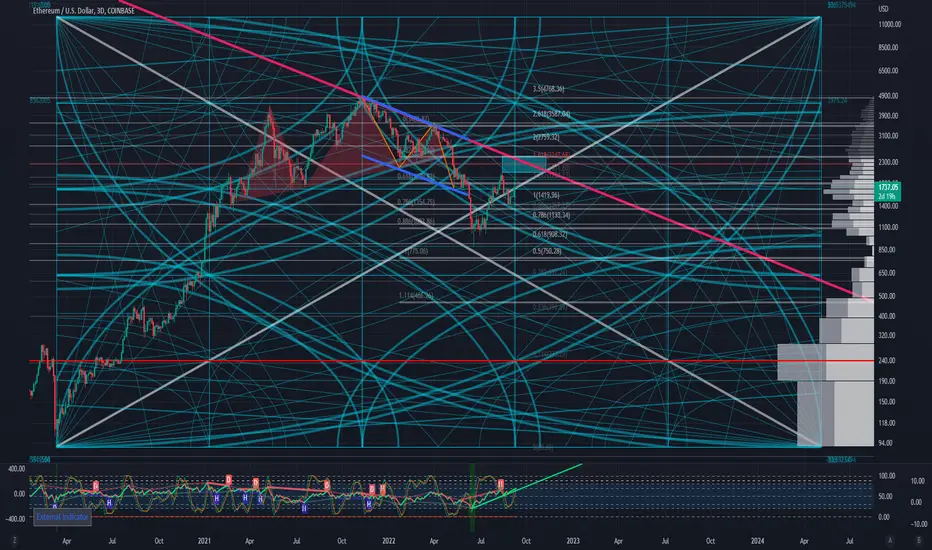
This is an elaboration of my previous idea about the ETH's resistance levels, this time using Gann Square (and arcs).
As can be seen, every arc and fan behaves as support & resistance.
White diagoanl line is Gann 1 x 1. Trends above it are sad to be strong, and trends below it are weak if the square is properly applied.
Overall, this Diagram shows how important but difficult it is for ETH to break through the two key levels: the current price zone and the previous high.
Note
I attach the linear-scale version of the chart. The main chart is log-scaled.
The linear one is clearer on why I emphasize the resistances.
Note
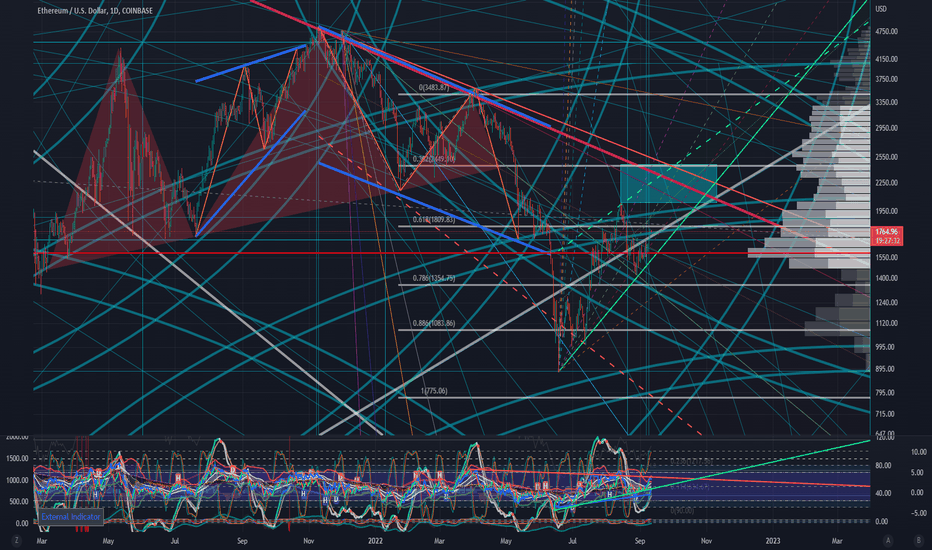
Check out the update.
Visibility improved.

Publications connexes
Clause de non-responsabilité
Les informations et publications ne sont pas destinées à être, et ne constituent pas, des conseils ou recommandations financiers, d'investissement, de trading ou autres fournis ou approuvés par TradingView. Pour en savoir plus, consultez les Conditions d'utilisation.
Publications connexes
Clause de non-responsabilité
Les informations et publications ne sont pas destinées à être, et ne constituent pas, des conseils ou recommandations financiers, d'investissement, de trading ou autres fournis ou approuvés par TradingView. Pour en savoir plus, consultez les Conditions d'utilisation.