
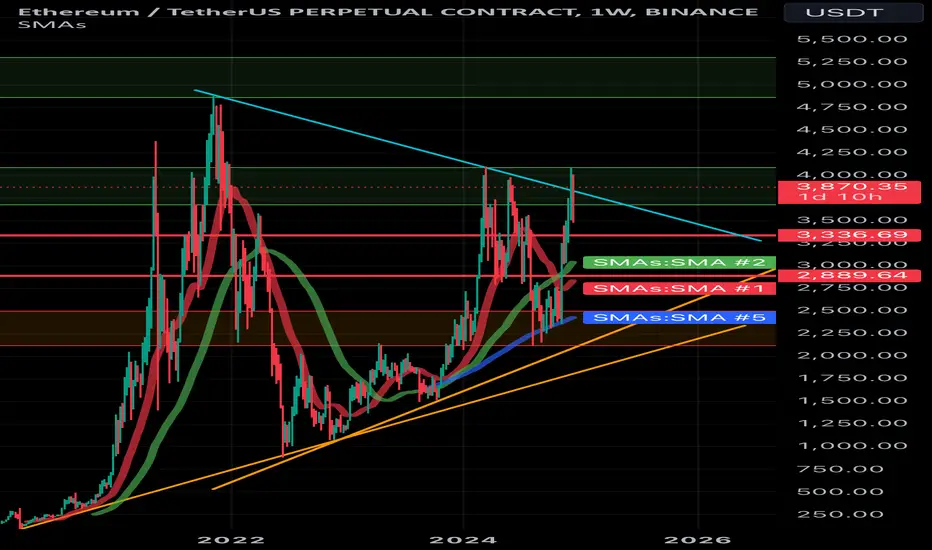
Hello everyone, I invite you to review the ETH/USD chart taking into account the interval of one weekend.
We can observe how the price is struggling to maintain the level of the downward trend line marked in blue.
Moreover, we can see how the price is currently fighting in a strong resistance zone from $3,677 to $4,087, we can see how the upper border of the zone has rejected the price, only when it manages to break out of it positively, the price will move towards the second very strong zone from $4,864 to $5,305 .
When the current resistance zone completely rejects the price and strong declines begin, support is visible at $3,336, then there is support at $2,889, and then a strong support zone is visible from $2,498 to $2,116.
We can observe how the price is struggling to maintain the level of the downward trend line marked in blue.
Moreover, we can see how the price is currently fighting in a strong resistance zone from $3,677 to $4,087, we can see how the upper border of the zone has rejected the price, only when it manages to break out of it positively, the price will move towards the second very strong zone from $4,864 to $5,305 .
When the current resistance zone completely rejects the price and strong declines begin, support is visible at $3,336, then there is support at $2,889, and then a strong support zone is visible from $2,498 to $2,116.

Clause de non-responsabilité
Les informations et publications ne sont pas destinées à être, et ne constituent pas, des conseils ou recommandations financiers, d'investissement, de trading ou autres fournis ou approuvés par TradingView. Pour en savoir plus, consultez les Conditions d'utilisation.
Clause de non-responsabilité
Les informations et publications ne sont pas destinées à être, et ne constituent pas, des conseils ou recommandations financiers, d'investissement, de trading ou autres fournis ou approuvés par TradingView. Pour en savoir plus, consultez les Conditions d'utilisation.