
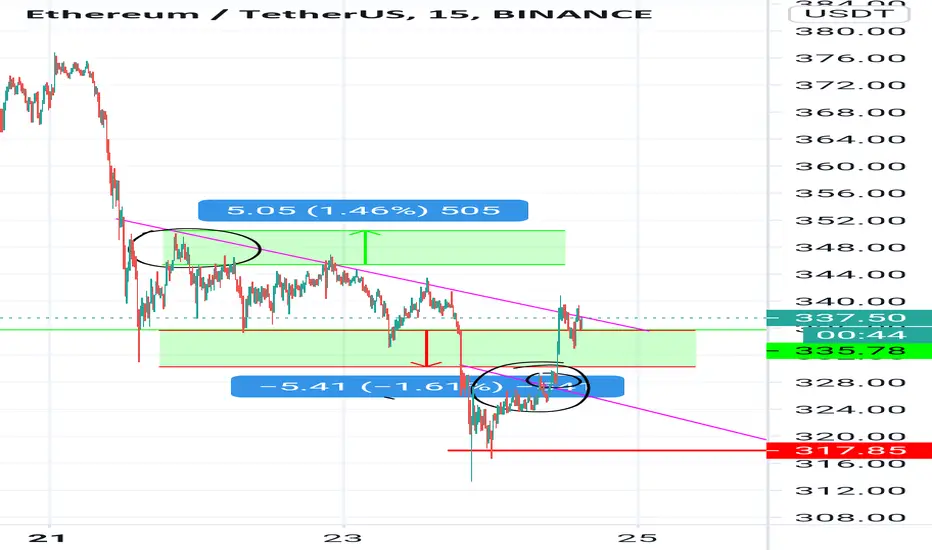
In the graph I have rounded two points..the curves look similar but difference between two moves are..the above curve retested the resistance level..but it took downward path..
The below curve why it exploded up? The reason is after retest near the resistance it consolidated near the resistance that's a indicator of a bullish move..the inner circle below circled one is the consolidated area
The below curve why it exploded up? The reason is after retest near the resistance it consolidated near the resistance that's a indicator of a bullish move..the inner circle below circled one is the consolidated area
Trade fermée: cible de profit atteinte
If u guys watch the move in 5m time frame it would be a better clarity
Clause de non-responsabilité
Les informations et publications ne sont pas destinées à être, et ne constituent pas, des conseils ou recommandations financiers, d'investissement, de trading ou autres fournis ou approuvés par TradingView. Pour en savoir plus, consultez les Conditions d'utilisation.
Clause de non-responsabilité
Les informations et publications ne sont pas destinées à être, et ne constituent pas, des conseils ou recommandations financiers, d'investissement, de trading ou autres fournis ou approuvés par TradingView. Pour en savoir plus, consultez les Conditions d'utilisation.