
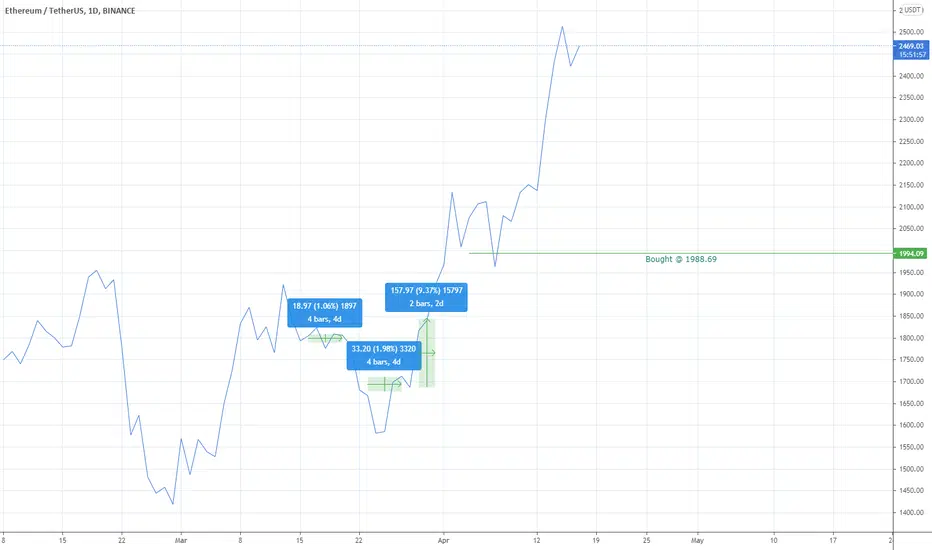
AI Bot purchased on 4 Apr 21. I changed the graph to a line chart because trading only happens at the opening of the next day. It takes into consideration historical daily movements, time series indicators. The machine learning model tries to predict the bottoms (buy level) and tops (sell level) of the daily close line chart.
Note
Still no sell signal from the ML model and holding with profit.Trade fermée: cible de profit atteinte
AI Bot sold at a rally at 2342.54Note
Update: I calculated a 17%+ return on that trade.
Clause de non-responsabilité
Les informations et publications ne sont pas destinées à être, et ne constituent pas, des conseils ou recommandations financiers, d'investissement, de trading ou autres fournis ou approuvés par TradingView. Pour en savoir plus, consultez les Conditions d'utilisation.
Clause de non-responsabilité
Les informations et publications ne sont pas destinées à être, et ne constituent pas, des conseils ou recommandations financiers, d'investissement, de trading ou autres fournis ou approuvés par TradingView. Pour en savoir plus, consultez les Conditions d'utilisation.