
Ethereum (ETH) technical analysis:
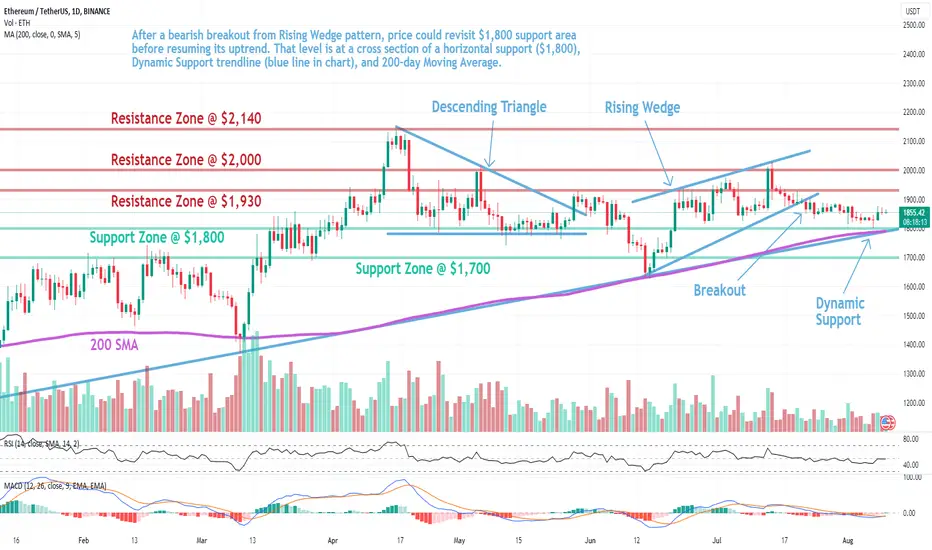
Trade setup: After a bearish breakout from Rising Wedge pattern, price could revisit $1,800 support area before resuming its uptrend. That level is at a cross section of a horizontal support ($1,800), Dynamic Support trendline (blue line in chart), and 200-day Moving Average.
Trend: Neutral on Short-Term basis, Uptrend on Medium-Term basis and Downtrend on Long-Term basis.
Momentum is Mixed as MACD Line is below MACD Signal Line (Bearish) but RSI ~ 50 (Neutral). MACD Histogram bars are rising, which suggests that momentum could be nearing another upswing.
Support and Resistance: Nearest Support Zone is $1,800 (previous resistance), then $1,700. The nearest Resistance Zone is $1,930, then $2,000 and $2,140.
Trade setup: After a bearish breakout from Rising Wedge pattern, price could revisit $1,800 support area before resuming its uptrend. That level is at a cross section of a horizontal support ($1,800), Dynamic Support trendline (blue line in chart), and 200-day Moving Average.
Trend: Neutral on Short-Term basis, Uptrend on Medium-Term basis and Downtrend on Long-Term basis.
Momentum is Mixed as MACD Line is below MACD Signal Line (Bearish) but RSI ~ 50 (Neutral). MACD Histogram bars are rising, which suggests that momentum could be nearing another upswing.
Support and Resistance: Nearest Support Zone is $1,800 (previous resistance), then $1,700. The nearest Resistance Zone is $1,930, then $2,000 and $2,140.

Clause de non-responsabilité
Les informations et publications ne sont pas destinées à être, et ne constituent pas, des conseils ou recommandations financiers, d'investissement, de trading ou autres fournis ou approuvés par TradingView. Pour en savoir plus, consultez les Conditions d'utilisation.
Clause de non-responsabilité
Les informations et publications ne sont pas destinées à être, et ne constituent pas, des conseils ou recommandations financiers, d'investissement, de trading ou autres fournis ou approuvés par TradingView. Pour en savoir plus, consultez les Conditions d'utilisation.