
Ethereum is about to accelerate its rise?

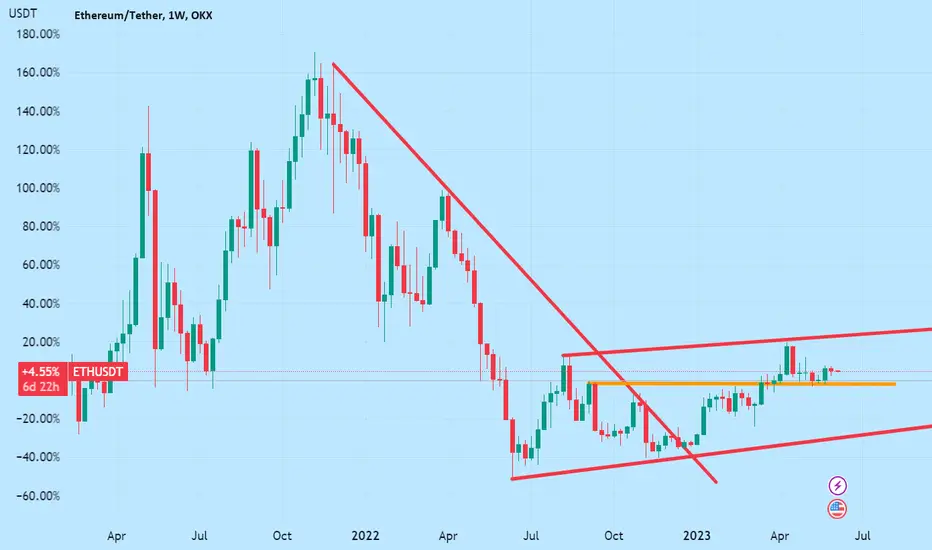
This figure shows the weekly candle chart of Ethereum for the past two years. The graph overlays the lines connecting the highs and lows of the past two years, the lines connecting the lows and lows, and the horizontal lines of recent key positions. As shown in the figure, after the shape of the head and shoulders of Ethereum is formed, the overall trend shows a slow upward oscillation with an angle of less than 15 degrees. Recently, Ethereum once again broke through and stepped back to confirm the short start position near 1751 before the shoulder position, and then began to steadily move up! In the future, Ethereum is likely to accelerate its rise and explore the upper edge of the upward channel line in the graph!
This figure shows the weekly candle chart of Ethereum for the past two years. The graph overlays the lines connecting the highs and lows of the past two years, the lines connecting the lows and lows, and the horizontal lines of recent key positions. As shown in the figure, after the shape of the head and shoulders of Ethereum is formed, the overall trend shows a slow upward oscillation with an angle of less than 15 degrees. Recently, Ethereum once again broke through and stepped back to confirm the short start position near 1751 before the shoulder position, and then began to steadily move up! In the future, Ethereum is likely to accelerate its rise and explore the upper edge of the upward channel line in the graph!

Clause de non-responsabilité
Les informations et publications ne sont pas destinées à être, et ne constituent pas, des conseils ou recommandations financiers, d'investissement, de trading ou autres fournis ou approuvés par TradingView. Pour en savoir plus, consultez les Conditions d'utilisation.
Clause de non-responsabilité
Les informations et publications ne sont pas destinées à être, et ne constituent pas, des conseils ou recommandations financiers, d'investissement, de trading ou autres fournis ou approuvés par TradingView. Pour en savoir plus, consultez les Conditions d'utilisation.