
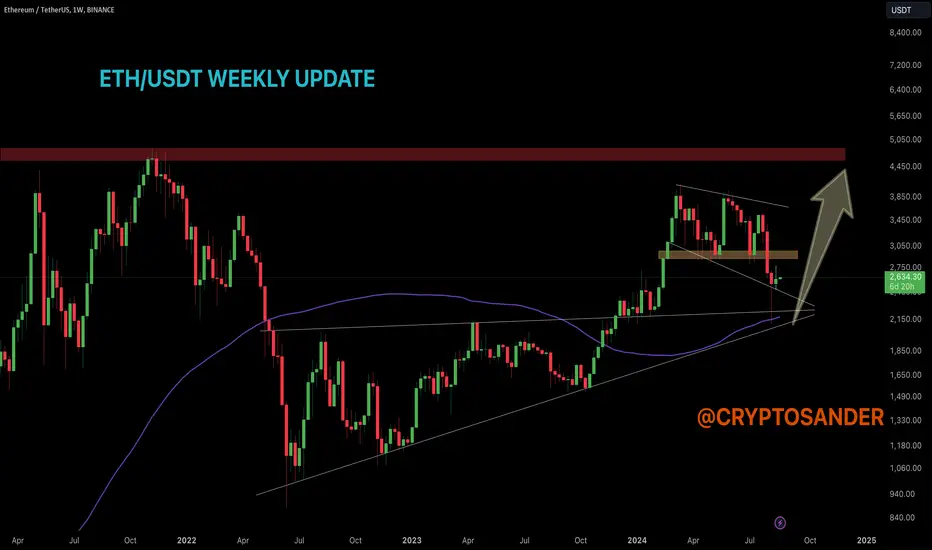
ETH/USDT is currently testing key resistance levels within the descending channel. A breakout above $3,050 could lead to a retest of higher resistance areas around $3,850. The 100MA near $2,150 has provided strong support, and the price needs to be above this level to maintain the bullish momentum. Traders should keep an eye on volume confirmation and price action near these crucial levels.
This update provides a concise analysis of the ETH/USDT weekly chart, focusing on key support and resistance levels, moving averages, chart patterns, and volume considerations.
Remember: This is not financial advice. Stay tuned to us for further updates and analysis. Thank you!
This update provides a concise analysis of the ETH/USDT weekly chart, focusing on key support and resistance levels, moving averages, chart patterns, and volume considerations.
Remember: This is not financial advice. Stay tuned to us for further updates and analysis. Thank you!

Publications connexes
Clause de non-responsabilité
Les informations et publications ne sont pas destinées à être, et ne constituent pas, des conseils ou recommandations financiers, d'investissement, de trading ou autres fournis ou approuvés par TradingView. Pour en savoir plus, consultez les Conditions d'utilisation.