

Educational Context
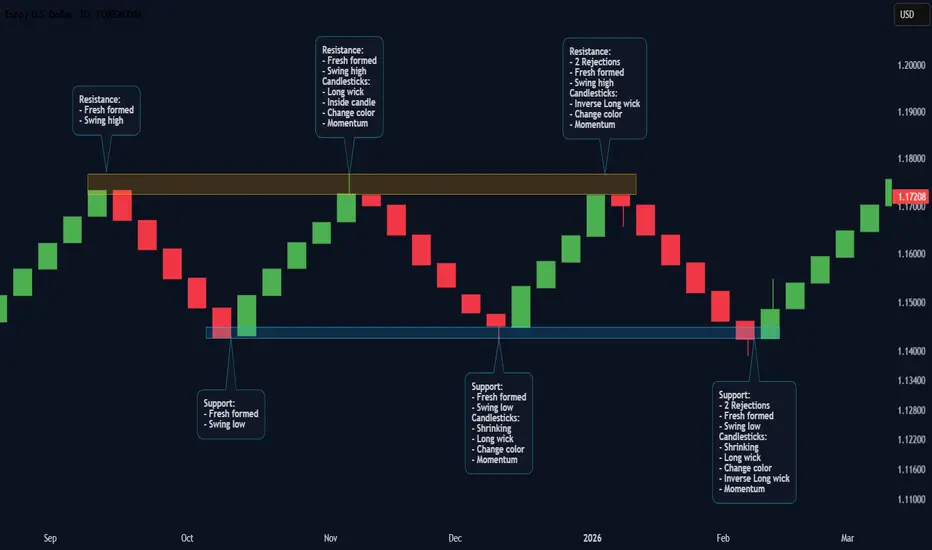
This lesson illustrates how price behaves inside a ranging market:
⬆️ Upper boundary → Resistance
⬇️ Lower boundary → Support
by combining Candlesticks and Support & Resistance into a single structural context.
The goal is to improve price reading and market awareness — not prediction.
Scenario 1 – Resistance Reaction (Range High)
⬆️ Resistance
• Fresh formed
• Swing high
🕯️ Candlesticks
• Long wick
• Inside candle
• Change color
• Momentum
🧠 Illustrated Interpretation
↳ Price pushes up ⬆️ into resistance
↳ Upper wick shows rejection ⛔
↳ Inside candle reflects hesitation
↳ Momentum fades near range top
📌 Structure remains capped at the range high
Scenario 2 – Support Reaction (Range Low)
⬇️ Support
• Fresh formed
• Swing low
🕯️ Candlesticks
• Shrinking candles
• Long wick
• Change color
• Momentum
🧠 Illustrated Interpretation
↳ Price declines ⬇️ into support
↳ Long lower wick shows defense 🛡️
↳ Shrinking candles indicate slowing pressure
↳ Buyers absorb selling near the range low
📌 Market stays balanced inside the range
Scenario 3 – Resistance With Multiple Rejections
⬆️ Resistance
• 2 rejections
• Fresh formed
• Swing high
🕯️ Candlesticks
• Inverse long wick
• Change color
• Momentum
🧠 Illustrated Interpretation
↳ Price tests resistance multiple times 🔁
↳ Inverse wicks show failed continuation
↳ Color change signals loss of upside strength
↳ Range ceiling becomes structurally valid
📌 Breakout failure, not trend confirmation
Scenario 4 – Support With Multiple Rejections
⬇️ Support
• 2 rejections
• Fresh formed
• Swing low
🕯️ Candlesticks
• Shrinking candles
• Long wick
• Change color
• Inverse long wick
• Momentum
🧠 Illustrated Interpretation
↳ Price repeatedly fails to break down ⛔⬇️
↳ Long wicks show rejection below support
↳ Shrinking candles reflect reduced selling
↳ Range floor holds structurally
📌 Support acts as a balance zone
Key Educational Insight
🧩 Candlesticks → show reaction
📐 Support & Resistance → define boundaries
➡️ In ranging markets, price moves between zones, not directions.
Important Educational Notice
• These are structural illustrations, not signals
• No trade execution is implied
• No outcome is guaranteed
This lesson focuses on understanding price behavior, not forecasting.
ETHICAL & EDUCATIONAL NOTICE
This content is presented solely for educational and analytical purposes, based on historical price data.
It does not promote or encourage any specific trading method, financial instrument, gambling, leverage, margin usage, short selling, or interest-based activity.
Readers are encouraged to align any financial activity with their own ethical, legal, and religious principles.
⚠️ DISCLAIMER
This material is strictly educational and informational.
It does not constitute financial advice, investment recommendations, or trading instructions.
The author does not provide personalized guidance.
Any decisions made based on this content are the sole responsibility of the individual.
This lesson illustrates how price behaves inside a ranging market:
⬆️ Upper boundary → Resistance
⬇️ Lower boundary → Support
by combining Candlesticks and Support & Resistance into a single structural context.
The goal is to improve price reading and market awareness — not prediction.
Scenario 1 – Resistance Reaction (Range High)
⬆️ Resistance
• Fresh formed
• Swing high
🕯️ Candlesticks
• Long wick
• Inside candle
• Change color
• Momentum
🧠 Illustrated Interpretation
↳ Price pushes up ⬆️ into resistance
↳ Upper wick shows rejection ⛔
↳ Inside candle reflects hesitation
↳ Momentum fades near range top
📌 Structure remains capped at the range high
Scenario 2 – Support Reaction (Range Low)
⬇️ Support
• Fresh formed
• Swing low
🕯️ Candlesticks
• Shrinking candles
• Long wick
• Change color
• Momentum
🧠 Illustrated Interpretation
↳ Price declines ⬇️ into support
↳ Long lower wick shows defense 🛡️
↳ Shrinking candles indicate slowing pressure
↳ Buyers absorb selling near the range low
📌 Market stays balanced inside the range
Scenario 3 – Resistance With Multiple Rejections
⬆️ Resistance
• 2 rejections
• Fresh formed
• Swing high
🕯️ Candlesticks
• Inverse long wick
• Change color
• Momentum
🧠 Illustrated Interpretation
↳ Price tests resistance multiple times 🔁
↳ Inverse wicks show failed continuation
↳ Color change signals loss of upside strength
↳ Range ceiling becomes structurally valid
📌 Breakout failure, not trend confirmation
Scenario 4 – Support With Multiple Rejections
⬇️ Support
• 2 rejections
• Fresh formed
• Swing low
🕯️ Candlesticks
• Shrinking candles
• Long wick
• Change color
• Inverse long wick
• Momentum
🧠 Illustrated Interpretation
↳ Price repeatedly fails to break down ⛔⬇️
↳ Long wicks show rejection below support
↳ Shrinking candles reflect reduced selling
↳ Range floor holds structurally
📌 Support acts as a balance zone
Key Educational Insight
🧩 Candlesticks → show reaction
📐 Support & Resistance → define boundaries
➡️ In ranging markets, price moves between zones, not directions.
Important Educational Notice
• These are structural illustrations, not signals
• No trade execution is implied
• No outcome is guaranteed
This lesson focuses on understanding price behavior, not forecasting.
ETHICAL & EDUCATIONAL NOTICE
This content is presented solely for educational and analytical purposes, based on historical price data.
It does not promote or encourage any specific trading method, financial instrument, gambling, leverage, margin usage, short selling, or interest-based activity.
Readers are encouraged to align any financial activity with their own ethical, legal, and religious principles.
⚠️ DISCLAIMER
This material is strictly educational and informational.
It does not constitute financial advice, investment recommendations, or trading instructions.
The author does not provide personalized guidance.
Any decisions made based on this content are the sole responsibility of the individual.

Publications connexes
Clause de non-responsabilité
Les informations et publications ne sont pas destinées à être, et ne constituent pas, des conseils ou recommandations financiers, d'investissement, de trading ou autres fournis ou approuvés par TradingView. Pour en savoir plus, consultez les Conditions d'utilisation.
Publications connexes
Clause de non-responsabilité
Les informations et publications ne sont pas destinées à être, et ne constituent pas, des conseils ou recommandations financiers, d'investissement, de trading ou autres fournis ou approuvés par TradingView. Pour en savoir plus, consultez les Conditions d'utilisation.