

Context
The Lagging Span (Ls), or Chikou Span, is the current period’s closing price plotted 26 periods back on the chart. Many Ichimoku materials reduce the Ls to a simple confirmation tool: above price is bullish, below price is bearish - while some omit it entirely. As a result, much of its deeper analytical value is often missed.
Core concept
The key idea is that the Lagging Span, as it is plotted 26 periods back, travels through a historical environment, thus, it should not be judged only by its position, but also by the quality of the path around it and ahead of it.
That path can contain prior:
All of these elements can act as obstacles. Together, they determine whether the Lagging Span is moving through clean or crowded historical structure. A Lagging Span moving through open historical space is usually more supportive of a clean setup. A Lagging Span pressing into candles, cloud boundaries, or flat levels often warns that the move may struggle, hesitate, or fail.
What this chart shows
This chart illustrates examples of how the Lagging Span path can reveal information that is not immediately obvious from current price alone:
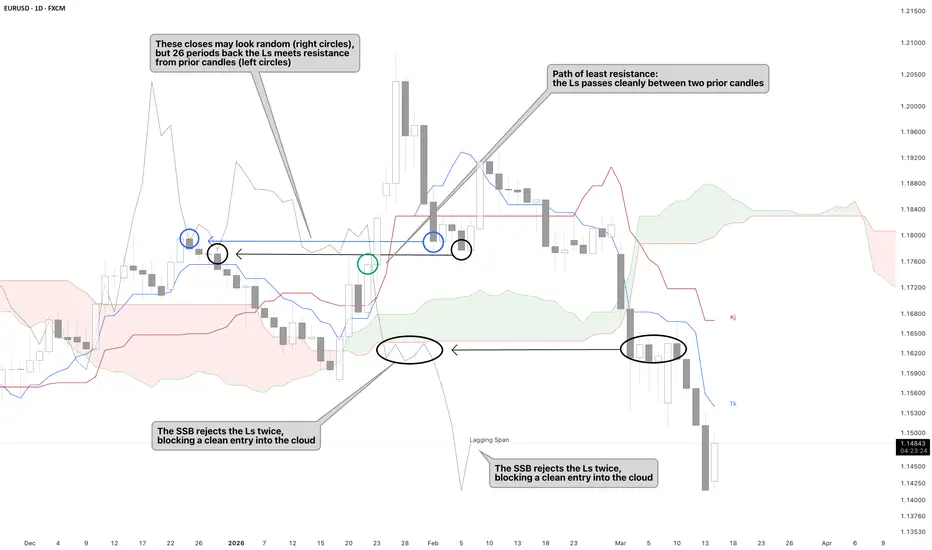
Blue and black circles: similar current closes, different historical context
The price closes marked by the blue and black circles may initially look random or unremarkable. However, once the reading is shifted 26 periods back, the corresponding blue and black circles on the left reveal that the Lagging Span is running directly into prior candles, which helps explain why price could not continue lower.
Left ellipse: the SSB rejecting the Lagging Span twice
The chart also shows the interaction between the Lagging Span and a SSB. Here, the SSB acts as resistance and rejects the Ls twice (left ellipse), preventing a clean move into the cloud despite the fact the price has no direct resistance / support (right ellipse).
Green circle: The path of least resistance between two prior candles
By contrast, in the example highlighted on the green circle, the Lagging Span passes between two prior candles with much less interference. This is a good illustration of the path of least resistance: the Ls is not pressing directly into historical price structure.
Current LS position: freedom in both axes
Finally, at the current position of the Lagging Span, there is no nearby obstacle immediately above or below it, and its forward path is also clear. In that sense, the LS is relatively free to move in either direction.
Trading implication
The practical lesson is simple: do not judge the Lagging Span only by whether it is above or below price. Instead, judge it by the quality of the space around it and the path it must travel through historical structure:
A setup may look acceptable on current price alone, yet still be weak if the Lagging Span is running into prior obstacles. On the other hand, when the LS has a clean path, the setup is often more reliable and the confirmation stronger.
This approach can help filter weak entries, avoid premature trades, confirm cleaner setups, and manage trades already in progress.
The Lagging Span (Ls), or Chikou Span, is the current period’s closing price plotted 26 periods back on the chart. Many Ichimoku materials reduce the Ls to a simple confirmation tool: above price is bullish, below price is bearish - while some omit it entirely. As a result, much of its deeper analytical value is often missed.
Core concept
The key idea is that the Lagging Span, as it is plotted 26 periods back, travels through a historical environment, thus, it should not be judged only by its position, but also by the quality of the path around it and ahead of it.
That path can contain prior:
- candle bodies,
- wicks,
- Cloud boundaries (SSA and SSB),
- Kijun-sen and Tenkan-sen,
- and even trendlines.
All of these elements can act as obstacles. Together, they determine whether the Lagging Span is moving through clean or crowded historical structure. A Lagging Span moving through open historical space is usually more supportive of a clean setup. A Lagging Span pressing into candles, cloud boundaries, or flat levels often warns that the move may struggle, hesitate, or fail.
What this chart shows
This chart illustrates examples of how the Lagging Span path can reveal information that is not immediately obvious from current price alone:
Blue and black circles: similar current closes, different historical context
The price closes marked by the blue and black circles may initially look random or unremarkable. However, once the reading is shifted 26 periods back, the corresponding blue and black circles on the left reveal that the Lagging Span is running directly into prior candles, which helps explain why price could not continue lower.
Left ellipse: the SSB rejecting the Lagging Span twice
The chart also shows the interaction between the Lagging Span and a SSB. Here, the SSB acts as resistance and rejects the Ls twice (left ellipse), preventing a clean move into the cloud despite the fact the price has no direct resistance / support (right ellipse).
Green circle: The path of least resistance between two prior candles
By contrast, in the example highlighted on the green circle, the Lagging Span passes between two prior candles with much less interference. This is a good illustration of the path of least resistance: the Ls is not pressing directly into historical price structure.
Current LS position: freedom in both axes
Finally, at the current position of the Lagging Span, there is no nearby obstacle immediately above or below it, and its forward path is also clear. In that sense, the LS is relatively free to move in either direction.
Trading implication
The practical lesson is simple: do not judge the Lagging Span only by whether it is above or below price. Instead, judge it by the quality of the space around it and the path it must travel through historical structure:
- vertically, by the obstacles directly above or below it,
- horizontally, by the structures it is about to meet over the coming candles.
A setup may look acceptable on current price alone, yet still be weak if the Lagging Span is running into prior obstacles. On the other hand, when the LS has a clean path, the setup is often more reliable and the confirmation stronger.
This approach can help filter weak entries, avoid premature trades, confirm cleaner setups, and manage trades already in progress.

Clarity • Structure • Discipline
Clause de non-responsabilité
Les informations et publications ne sont pas destinées à être, et ne constituent pas, des conseils ou recommandations financiers, d'investissement, de trading ou autres fournis ou approuvés par TradingView. Pour en savoir plus, consultez les Conditions d'utilisation.
Clarity • Structure • Discipline
Clause de non-responsabilité
Les informations et publications ne sont pas destinées à être, et ne constituent pas, des conseils ou recommandations financiers, d'investissement, de trading ou autres fournis ou approuvés par TradingView. Pour en savoir plus, consultez les Conditions d'utilisation.