
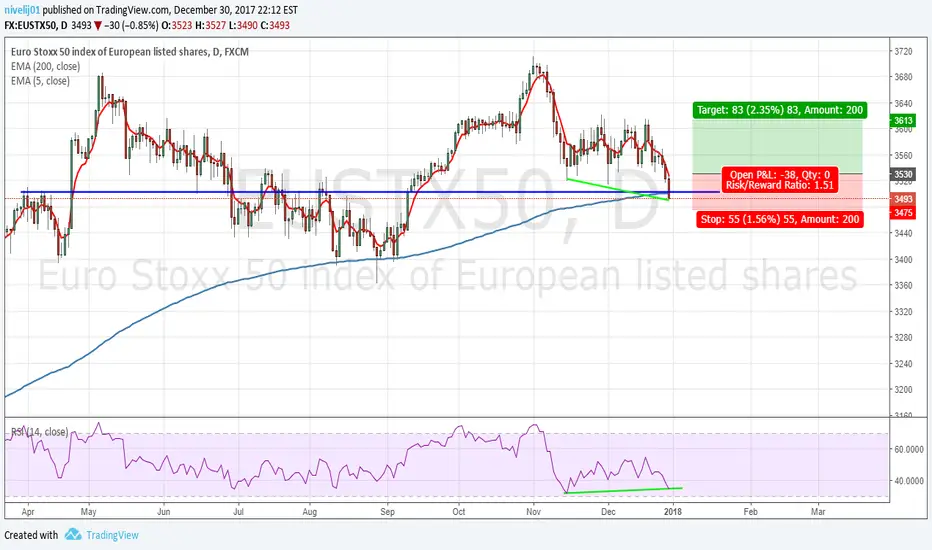
I can see a potential Long setup for EUSTX50 index. Couple of things that I observed:
1. Price is currently retesting EMA(200) and this is also a resistance-turned-support zone (back in April 2017).
2. A divergence observed between the chart and RSI(14), as chart is making lower low, whereas RSI(14) is making higher low.
If price can close around 3530 (which I roughly calculate should be when it close above EMA(50)), then I may open a Long position. Otherwise, no trade on this index.
1. Price is currently retesting EMA(200) and this is also a resistance-turned-support zone (back in April 2017).
2. A divergence observed between the chart and RSI(14), as chart is making lower low, whereas RSI(14) is making higher low.
If price can close around 3530 (which I roughly calculate should be when it close above EMA(50)), then I may open a Long position. Otherwise, no trade on this index.
Note
Typo, it's EMA(5), not EMA(50)Trade fermée manuellement
Closed the trade with profit for now.
Clause de non-responsabilité
Les informations et publications ne sont pas destinées à être, et ne constituent pas, des conseils ou recommandations financiers, d'investissement, de trading ou autres fournis ou approuvés par TradingView. Pour en savoir plus, consultez les Conditions d'utilisation.
Clause de non-responsabilité
Les informations et publications ne sont pas destinées à être, et ne constituent pas, des conseils ou recommandations financiers, d'investissement, de trading ou autres fournis ou approuvés par TradingView. Pour en savoir plus, consultez les Conditions d'utilisation.