Multi-Timeframe analysis: Facebook (May 2021)
Multi-Timeframe Analysis:
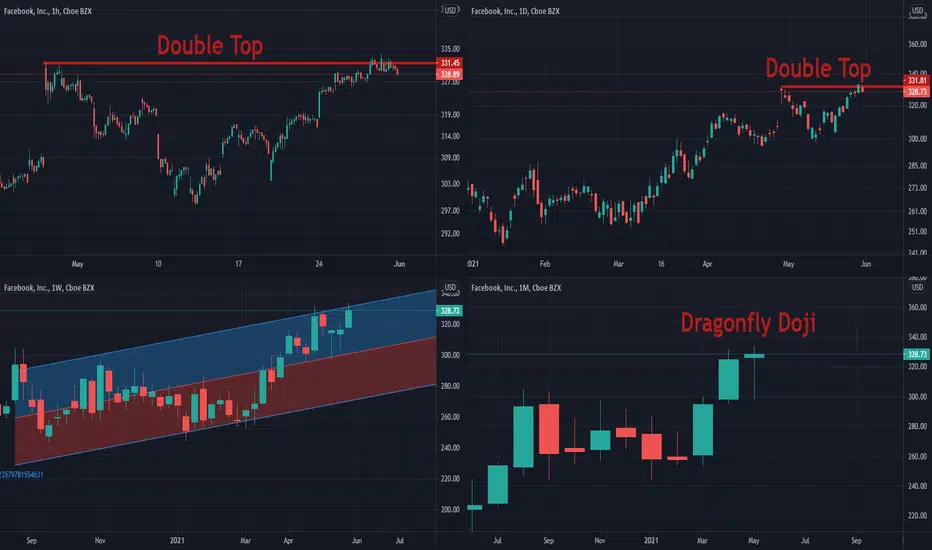
Hourly Chart: Double Top (Bearish)
Daily Chart: Double Top (Bearish)
Weekly Chart: at the top of the regression channel (Bearish)
Monthly Chart: Dragonfly Doji, possible reversal??? (Neutral-Bearish)
Daily average trading value (YTD): Trading 32 % below YTD (money outflow) ( Bearish )
Weekly average trading value: Trading 12% below the last trading year average. (money outflow) ( Bearish )
Monthly average trading value: Trading 5.5% below last trading year average. (money outflow) ( Bearish )
Conclusion: wait for reversal confirmation ( Neutral- Bearish )
Hourly Chart: Double Top (Bearish)
Daily Chart: Double Top (Bearish)
Weekly Chart: at the top of the regression channel (Bearish)
Monthly Chart: Dragonfly Doji, possible reversal??? (Neutral-Bearish)
Daily average trading value (YTD): Trading 32 % below YTD (money outflow) ( Bearish )
Weekly average trading value: Trading 12% below the last trading year average. (money outflow) ( Bearish )
Monthly average trading value: Trading 5.5% below last trading year average. (money outflow) ( Bearish )
Conclusion: wait for reversal confirmation ( Neutral- Bearish )

Use the following link to access trading ideas: patreon.com/SniperTraderStocks?utm_medium=unknown&utm_source=join_link&utm_campaign=creatorshare_creator&utm_content=copyLink
Clause de non-responsabilité
Les informations et publications ne sont pas destinées à être, et ne constituent pas, des conseils ou recommandations financiers, d'investissement, de trading ou autres fournis ou approuvés par TradingView. Pour en savoir plus, consultez les Conditions d'utilisation.
Use the following link to access trading ideas: patreon.com/SniperTraderStocks?utm_medium=unknown&utm_source=join_link&utm_campaign=creatorshare_creator&utm_content=copyLink
Clause de non-responsabilité
Les informations et publications ne sont pas destinées à être, et ne constituent pas, des conseils ou recommandations financiers, d'investissement, de trading ou autres fournis ou approuvés par TradingView. Pour en savoir plus, consultez les Conditions d'utilisation.