
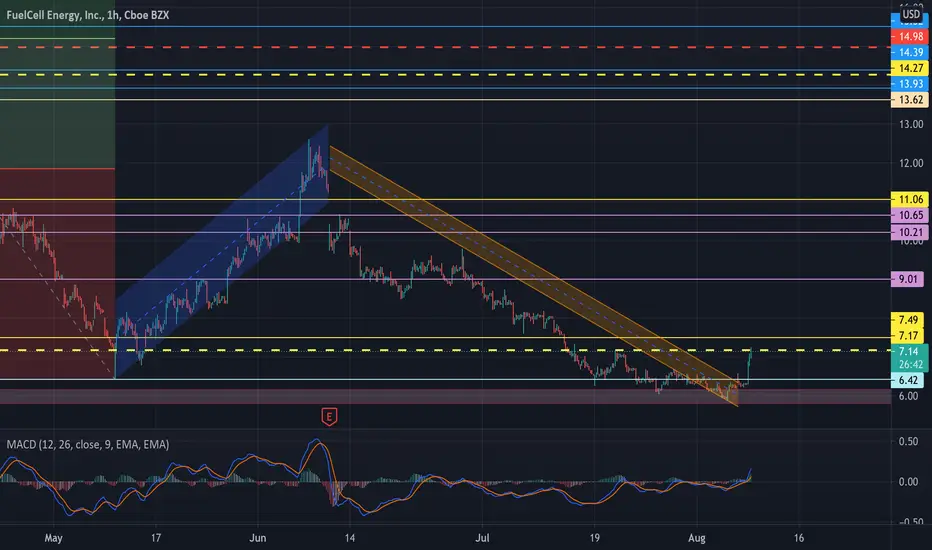
Disclaimer this may be wrong and I'm still learning like the rest; however, I've been holding since January and watched it go from 14 to 28 then all the way down to 6. So, to prevent bias in this information this is all a TA analysis thus each bar line above the current price represents old supports aka new resistance levels. Granted there will be some taking profit from swings so at the EOD we should sit at closer supports.

Publications connexes
Clause de non-responsabilité
Les informations et publications ne sont pas destinées à être, et ne constituent pas, des conseils ou recommandations financiers, d'investissement, de trading ou autres fournis ou approuvés par TradingView. Pour en savoir plus, consultez les Conditions d'utilisation.