
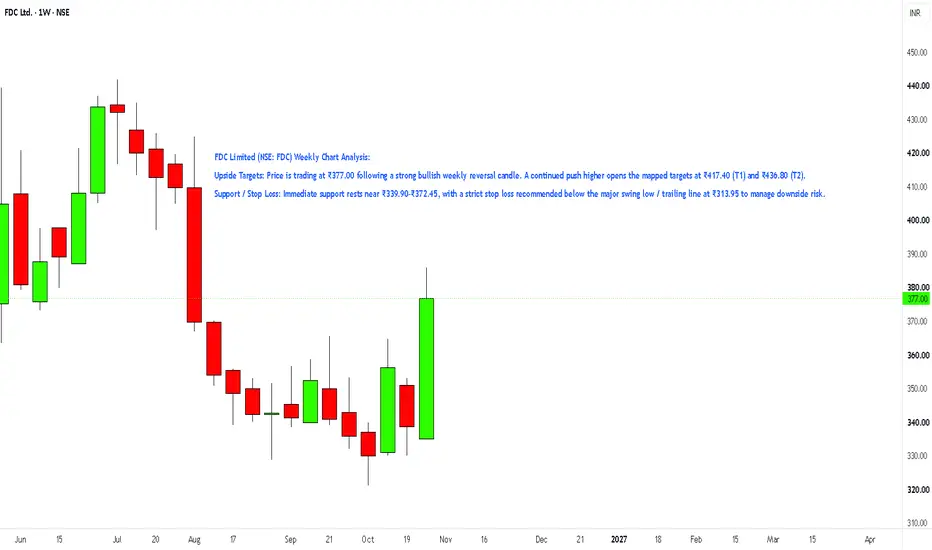
FDC Limited (NSE: FDC) Weekly Chart Analysis:
Upside Targets: Price is trading at ₹377.00 following a strong bullish weekly reversal candle. A continued push higher opens the mapped targets at ₹417.40 (T1) and ₹436.80 (T2).
Support / Stop Loss: Immediate support rests near ₹339.90–₹372.45, with a strict stop loss recommended below the major swing low / trailing line at ₹313.95 to manage downside risk.
Upside Targets: Price is trading at ₹377.00 following a strong bullish weekly reversal candle. A continued push higher opens the mapped targets at ₹417.40 (T1) and ₹436.80 (T2).
Support / Stop Loss: Immediate support rests near ₹339.90–₹372.45, with a strict stop loss recommended below the major swing low / trailing line at ₹313.95 to manage downside risk.

Automated Tools/Indicators/Screeners available at kkonline.org/nimblrta
Clause de non-responsabilité
Les informations et publications ne sont pas destinées à être, et ne constituent pas, des conseils ou recommandations financiers, d'investissement, de trading ou autres fournis ou approuvés par TradingView. Pour en savoir plus, consultez les Conditions d'utilisation.
Automated Tools/Indicators/Screeners available at kkonline.org/nimblrta
Clause de non-responsabilité
Les informations et publications ne sont pas destinées à être, et ne constituent pas, des conseils ou recommandations financiers, d'investissement, de trading ou autres fournis ou approuvés par TradingView. Pour en savoir plus, consultez les Conditions d'utilisation.