Long
FGV: Moving Averages Aligned, and at Oscillator Bottom
Thank you for your continued support :)
Strategy: Moving Averages Formation
Bias: Bullish
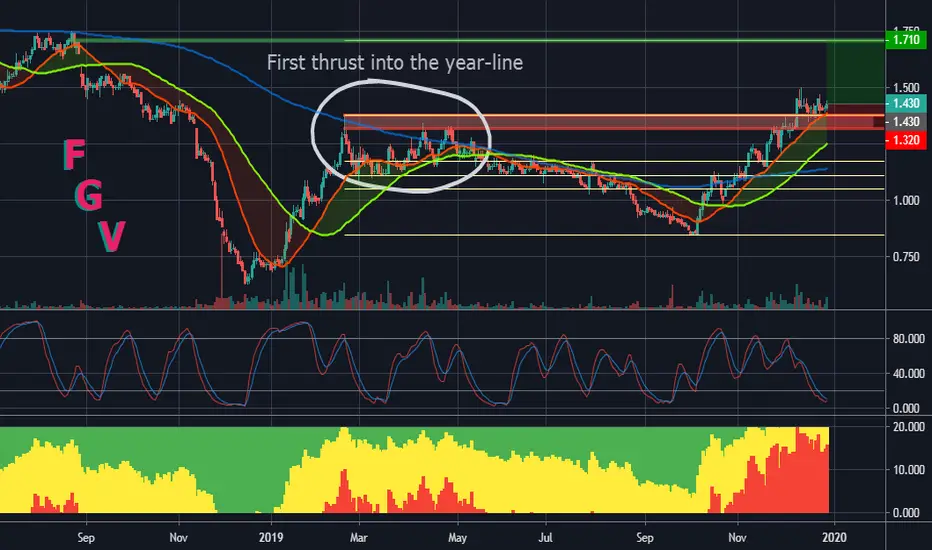
As seen in the chart, all three moving averages are aligned in bullish trend. Using the oscillator, price is now at the "oscillator" bottom. The "oscillator" bottom by itself is not a strong indicator, and usually is complemented with other technical analyses, such as moving averages and support/resistance/trend analysis here.
Entry: 1.43
Stop-loss: 1.32
1st Target: 1.71
Gentle reminder: Plan your trade and trade your plan. Peace out!
Strategy: Moving Averages Formation
Bias: Bullish
As seen in the chart, all three moving averages are aligned in bullish trend. Using the oscillator, price is now at the "oscillator" bottom. The "oscillator" bottom by itself is not a strong indicator, and usually is complemented with other technical analyses, such as moving averages and support/resistance/trend analysis here.
Entry: 1.43
Stop-loss: 1.32
1st Target: 1.71
Gentle reminder: Plan your trade and trade your plan. Peace out!

Clause de non-responsabilité
Les informations et publications ne sont pas destinées à être, et ne constituent pas, des conseils ou recommandations financiers, d'investissement, de trading ou autres fournis ou approuvés par TradingView. Pour en savoir plus, consultez les Conditions d'utilisation.
Clause de non-responsabilité
Les informations et publications ne sont pas destinées à être, et ne constituent pas, des conseils ou recommandations financiers, d'investissement, de trading ou autres fournis ou approuvés par TradingView. Pour en savoir plus, consultez les Conditions d'utilisation.