Long
FTM/USDT Long-Term
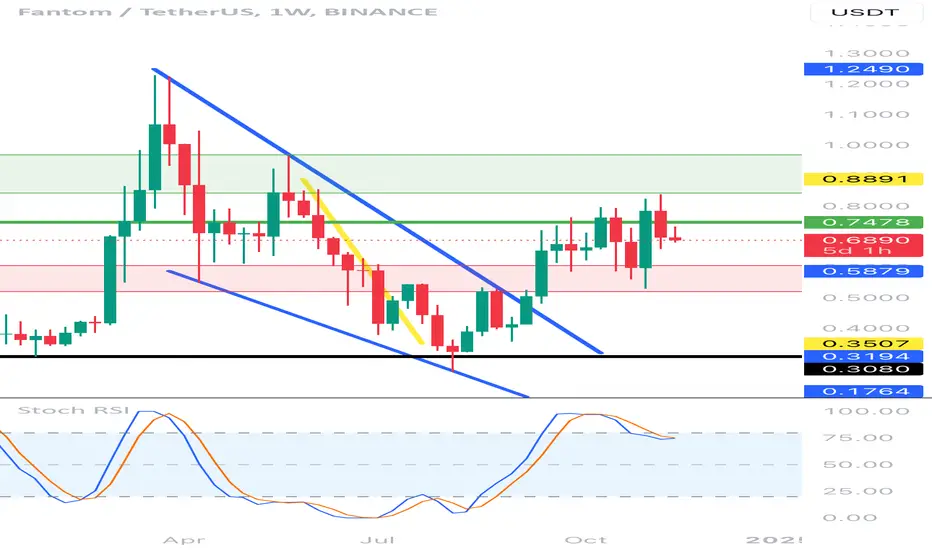
I invite you to take a quick look at the FTM to USDT chart over a one-weekend period. As we can see, the price moved upwards from the downward trend channel with dynamic movements.
Currently, we can see that we are moving between two zones, there is a strong support zone from $0.61 to $0.52, and a second resistance zone from $0.84 to $0.97.
Currently, we can see that we are moving between two zones, there is a strong support zone from $0.61 to $0.52, and a second resistance zone from $0.84 to $0.97.

Clause de non-responsabilité
Les informations et publications ne sont pas destinées à être, et ne constituent pas, des conseils ou recommandations financiers, d'investissement, de trading ou autres fournis ou approuvés par TradingView. Pour en savoir plus, consultez les Conditions d'utilisation.
Clause de non-responsabilité
Les informations et publications ne sont pas destinées à être, et ne constituent pas, des conseils ou recommandations financiers, d'investissement, de trading ou autres fournis ou approuvés par TradingView. Pour en savoir plus, consultez les Conditions d'utilisation.