
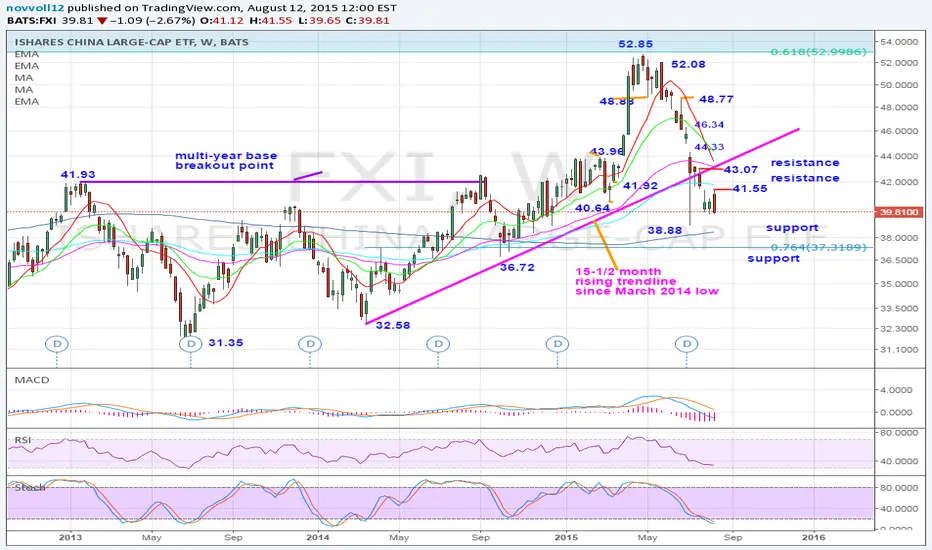
FXI looks to retest July’s spike low at 38.88 which is also near the 200 week moving average currently at 38.69. Below there lies the 36.72 support (September 29, 2014 low) near the 76.4% retracement of the 32.58/52.85 rise. 41.55 should cap near-term bounces.
Outlook:
Short term: bearish
Long term: bearish
Outlook:
Short term: bearish
Long term: bearish

Publications connexes
Clause de non-responsabilité
Les informations et publications ne sont pas destinées à être, et ne constituent pas, des conseils ou recommandations financiers, d'investissement, de trading ou autres fournis ou approuvés par TradingView. Pour en savoir plus, consultez les Conditions d'utilisation.
Publications connexes
Clause de non-responsabilité
Les informations et publications ne sont pas destinées à être, et ne constituent pas, des conseils ou recommandations financiers, d'investissement, de trading ou autres fournis ou approuvés par TradingView. Pour en savoir plus, consultez les Conditions d'utilisation.