
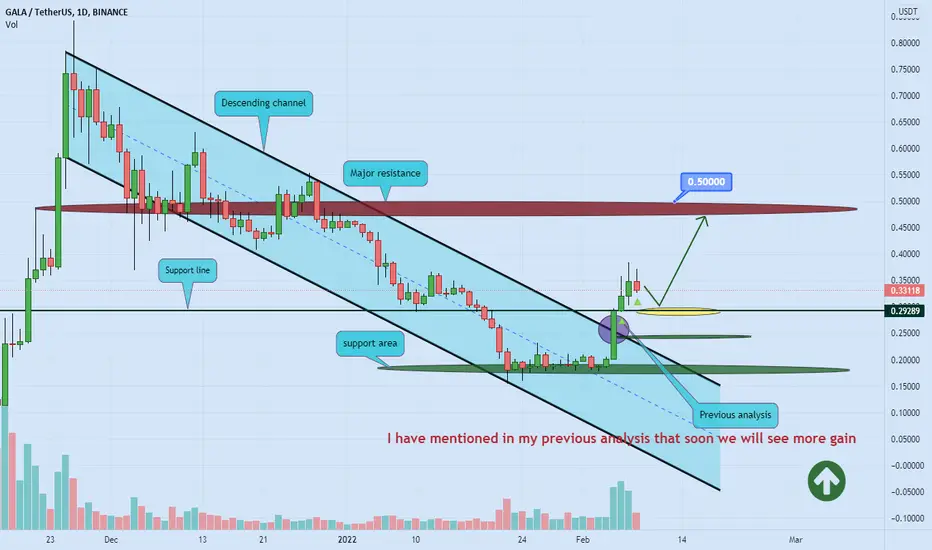
Based on the chart, the price breaks the descending channel to the upside and here brief correction to the downside based on the Fibonacci levels expected ✔️
and
near the yellow zone and support line we can again expect the continuation of the uptrend and our first target is 0.50 🚀
if
the price breaks the resistance there to the upside, we can see more gain 🚀🚀
and
the yellow zone on the chart is based on the Fibonacci levels ✔️
This is not financial advice, always do your own research.
Please, feel free to ask your question, write it in the comments below, and I will answer.
🐋
and
near the yellow zone and support line we can again expect the continuation of the uptrend and our first target is 0.50 🚀
if
the price breaks the resistance there to the upside, we can see more gain 🚀🚀
and
the yellow zone on the chart is based on the Fibonacci levels ✔️
This is not financial advice, always do your own research.
Please, feel free to ask your question, write it in the comments below, and I will answer.
🐋

Hi
If you enjoy my tips, please consider a tiny support🙏🙇🏼♂️
By trade safely on Bybit, world's #2 crypto exchange
Join via my link & get up to $30,000 gift👇
tinyurl.com/rejpptyd
Free signals:
t.me/madwhalechannel
thanks 🙏🙇🏼♂️
If you enjoy my tips, please consider a tiny support🙏🙇🏼♂️
By trade safely on Bybit, world's #2 crypto exchange
Join via my link & get up to $30,000 gift👇
tinyurl.com/rejpptyd
Free signals:
t.me/madwhalechannel
thanks 🙏🙇🏼♂️
Publications connexes
Clause de non-responsabilité
Les informations et publications ne sont pas destinées à être, et ne constituent pas, des conseils ou recommandations financiers, d'investissement, de trading ou autres fournis ou approuvés par TradingView. Pour en savoir plus, consultez les Conditions d'utilisation.