

1. Price Action Context
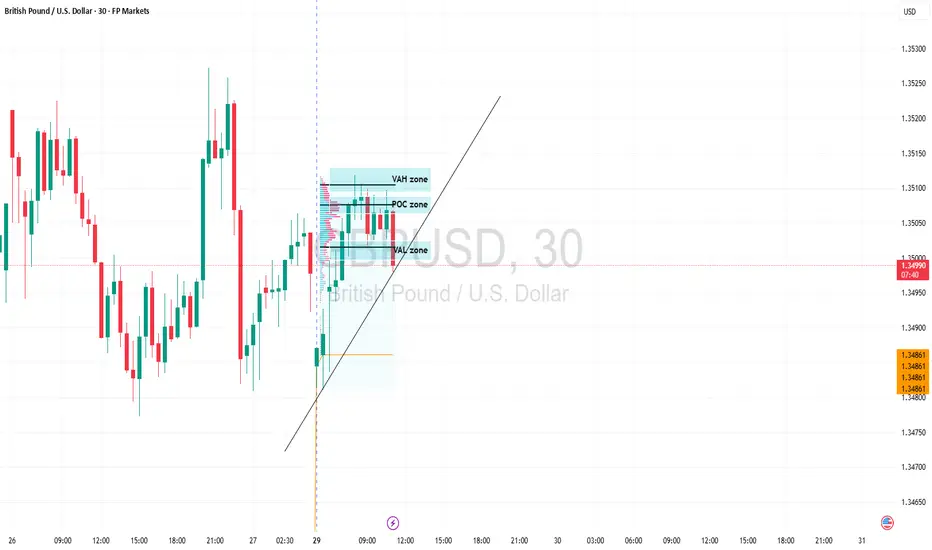
Main Trend: The pair is in a short-term Bullish trend, supported by a clearly defined upward-sloping trendline.
Current Position: The price is trading at 1.34997, hovering just below the 1.3500 psychological level.
Status: Price action shows signs of stalling and moving sideways (consolidation) after the previous rally, forming a tight range at the local peak.
2. Volume Profile Analysis
Your chart highlights critical high-volume zones:
VAH Zone (Value Area High): Around 1.35100. This serves as the overhead resistance. The price recently touched this area and was slightly rejected, indicating profit-taking.
POC Zone (Point of Control): Around 1.35070. This is the level with the highest concentration of trading volume. Currently, the price is sitting just below the POC, making it an immediate resistance.
VAL Zone (Value Area Low): Around 1.35030. Observation shows the price has slipped below the light blue VAL band and is currently testing the trendline.
3. Critical Observations
Trendline Stability: The price is hugging the bullish trendline very closely. A 30-minute candle close below this line would signal a weakening of the upward momentum.
Buying Exhaustion: The most recent candles show small bodies and long upper wicks, suggesting that buyers are losing steam as they approach the 1.35100 mark.
Lower Support: If the trendline breaks, the price is likely to drop toward the orange support zone below, near 1.34860.
4. Potential Scenarios
Bullish Scenario: The price needs to reclaim the POC (1.35070) and close above the VAH (1.35100) to confirm a continuation toward higher targets.
Bearish/Correction Scenario: If the price breaks the trendline and fails to hold 1.34950, it will likely enter a deeper technical correction toward the 1.34860 support level.
Summary: Closely monitor the reaction at the trendline. If you are holding long positions, consider tightening stop-losses or taking partial profits, as the price is struggling at the POC/VAH cluster.
Main Trend: The pair is in a short-term Bullish trend, supported by a clearly defined upward-sloping trendline.
Current Position: The price is trading at 1.34997, hovering just below the 1.3500 psychological level.
Status: Price action shows signs of stalling and moving sideways (consolidation) after the previous rally, forming a tight range at the local peak.
2. Volume Profile Analysis
Your chart highlights critical high-volume zones:
VAH Zone (Value Area High): Around 1.35100. This serves as the overhead resistance. The price recently touched this area and was slightly rejected, indicating profit-taking.
POC Zone (Point of Control): Around 1.35070. This is the level with the highest concentration of trading volume. Currently, the price is sitting just below the POC, making it an immediate resistance.
VAL Zone (Value Area Low): Around 1.35030. Observation shows the price has slipped below the light blue VAL band and is currently testing the trendline.
3. Critical Observations
Trendline Stability: The price is hugging the bullish trendline very closely. A 30-minute candle close below this line would signal a weakening of the upward momentum.
Buying Exhaustion: The most recent candles show small bodies and long upper wicks, suggesting that buyers are losing steam as they approach the 1.35100 mark.
Lower Support: If the trendline breaks, the price is likely to drop toward the orange support zone below, near 1.34860.
4. Potential Scenarios
Bullish Scenario: The price needs to reclaim the POC (1.35070) and close above the VAH (1.35100) to confirm a continuation toward higher targets.
Bearish/Correction Scenario: If the price breaks the trendline and fails to hold 1.34950, it will likely enter a deeper technical correction toward the 1.34860 support level.
Summary: Closely monitor the reaction at the trendline. If you are holding long positions, consider tightening stop-losses or taking partial profits, as the price is struggling at the POC/VAH cluster.

Publications connexes
Clause de non-responsabilité
Les informations et publications ne sont pas destinées à être, et ne constituent pas, des conseils ou recommandations financiers, d'investissement, de trading ou autres fournis ou approuvés par TradingView. Pour en savoir plus, consultez les Conditions d'utilisation.
Publications connexes
Clause de non-responsabilité
Les informations et publications ne sont pas destinées à être, et ne constituent pas, des conseils ou recommandations financiers, d'investissement, de trading ou autres fournis ou approuvés par TradingView. Pour en savoir plus, consultez les Conditions d'utilisation.