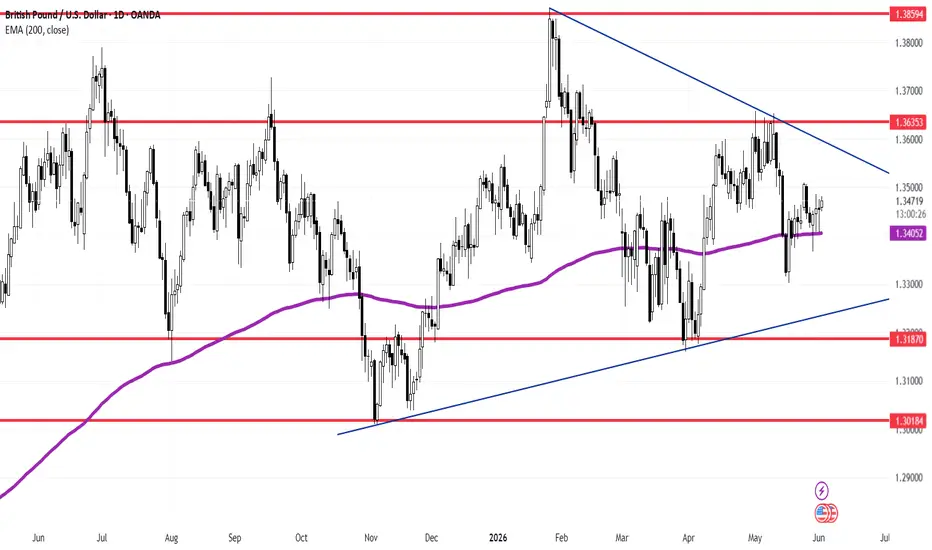
The British Pound / U.S. Dollar (
 GBPUSD) pair is displaying a highly defined range-bound structure on the Daily (1D) chart, flashing a high-probability mean-reversion bounce after an institutional baseline test.
### Structural Framework & Key Levels:
* **The Macro Rectangle:** Price action remains boxed within a clear horizontal range. Heavy overhead supply is firmly established at the **1.36353** resistance line, while a rock-solid demand floor sits lower at the **1.32062** support cluster.
* **The 200 EMA Springboard:** The dynamic purple line representing the **200-period Exponential Moving Average (EMA 200 at 1.33681)** was recently tested. The pair found aggressive buyer absorption right at this moving average, shifting the immediate order flow to the buy-side.
* **The Lower Timeframe Squeeze (LTB):** As the price gathers momentum to drive higher, traders should note the descending blue trendline acting as a multi-month LTB. While this line registers compression on the daily view, its technical interaction is highly active on lower timeframes (such as H4 or H1).
### Strategic Outlook & Targets:
The path of least resistance points toward a rotational swing back to the upper boundaries of the horizontal rectangle:
1. **The Tactical Drive:** Fueled by the successful structural defense of the Daily 200 EMA, GBPUSD is gathering strength to challenge local liquidity pools.
2. **The Macro Target (1.36353):** A clean breakout above the descending blue trendline on lower timeframes will act as the confirmation trigger, clearing the runway for a full expansion leg toward the primary structural ceiling at **1.36353**.
### Execution Blueprint:
Selling pressure has exhausted near the dynamic value zone. The high-odds play is to monitor lower timeframe structures (H4/H1) for any micro retests of the breakout above the immediate LTB, using those points to position for long swing legs targeting the **1.36353** horizontal wall.
---
📊 **ProData Chart** | By Rogerio Zaglia
*Technical Analysis, Price Action & Global Asset Research.*
⚠️ **Disclaimer:** For educational and informational purposes only. This study does not constitute financial advice or a trading recommendation.
GBPUSD) pair is displaying a highly defined range-bound structure on the Daily (1D) chart, flashing a high-probability mean-reversion bounce after an institutional baseline test.### Structural Framework & Key Levels:
* **The Macro Rectangle:** Price action remains boxed within a clear horizontal range. Heavy overhead supply is firmly established at the **1.36353** resistance line, while a rock-solid demand floor sits lower at the **1.32062** support cluster.
* **The 200 EMA Springboard:** The dynamic purple line representing the **200-period Exponential Moving Average (EMA 200 at 1.33681)** was recently tested. The pair found aggressive buyer absorption right at this moving average, shifting the immediate order flow to the buy-side.
* **The Lower Timeframe Squeeze (LTB):** As the price gathers momentum to drive higher, traders should note the descending blue trendline acting as a multi-month LTB. While this line registers compression on the daily view, its technical interaction is highly active on lower timeframes (such as H4 or H1).
### Strategic Outlook & Targets:
The path of least resistance points toward a rotational swing back to the upper boundaries of the horizontal rectangle:
1. **The Tactical Drive:** Fueled by the successful structural defense of the Daily 200 EMA, GBPUSD is gathering strength to challenge local liquidity pools.
2. **The Macro Target (1.36353):** A clean breakout above the descending blue trendline on lower timeframes will act as the confirmation trigger, clearing the runway for a full expansion leg toward the primary structural ceiling at **1.36353**.
### Execution Blueprint:
Selling pressure has exhausted near the dynamic value zone. The high-odds play is to monitor lower timeframe structures (H4/H1) for any micro retests of the breakout above the immediate LTB, using those points to position for long swing legs targeting the **1.36353** horizontal wall.
---
📊 **ProData Chart** | By Rogerio Zaglia
*Technical Analysis, Price Action & Global Asset Research.*
⚠️ **Disclaimer:** For educational and informational purposes only. This study does not constitute financial advice or a trading recommendation.

Clause de non-responsabilité
Les informations et publications ne sont pas destinées à être, et ne constituent pas, des conseils ou recommandations financiers, d'investissement, de trading ou autres fournis ou approuvés par TradingView. Pour en savoir plus, consultez les Conditions d'utilisation.
Clause de non-responsabilité
Les informations et publications ne sont pas destinées à être, et ne constituent pas, des conseils ou recommandations financiers, d'investissement, de trading ou autres fournis ou approuvés par TradingView. Pour en savoir plus, consultez les Conditions d'utilisation.