

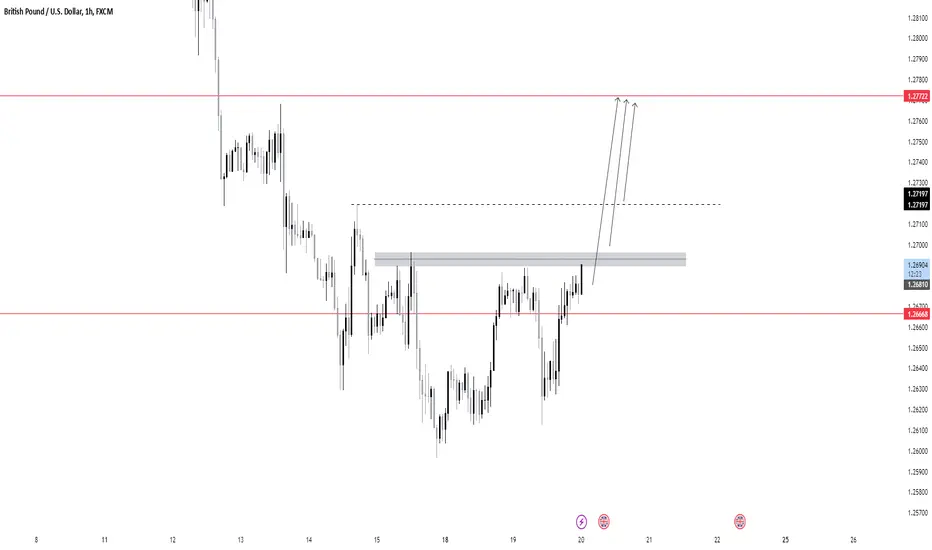
This chart displays the GBP/USD pair on the 1-hour timeframe currently leaning bullish, as the price has shown strength approaching the resistance.
The price is currently testing a key resistance zone around the 1.2689-1.2700 level, with potential bullish momentum indicated by the recent rally.
If the price breaks above the resistance zone and closes beyond 1.2700, it could indicate a continuation toward the next resistance level at 1.2777
The price is currently testing a key resistance zone around the 1.2689-1.2700 level, with potential bullish momentum indicated by the recent rally.
If the price breaks above the resistance zone and closes beyond 1.2700, it could indicate a continuation toward the next resistance level at 1.2777

iSmashProfit
Publications connexes
Clause de non-responsabilité
Les informations et publications ne sont pas destinées à être, et ne constituent pas, des conseils ou recommandations financiers, d'investissement, de trading ou autres fournis ou approuvés par TradingView. Pour en savoir plus, consultez les Conditions d'utilisation.
iSmashProfit
Publications connexes
Clause de non-responsabilité
Les informations et publications ne sont pas destinées à être, et ne constituent pas, des conseils ou recommandations financiers, d'investissement, de trading ou autres fournis ou approuvés par TradingView. Pour en savoir plus, consultez les Conditions d'utilisation.