
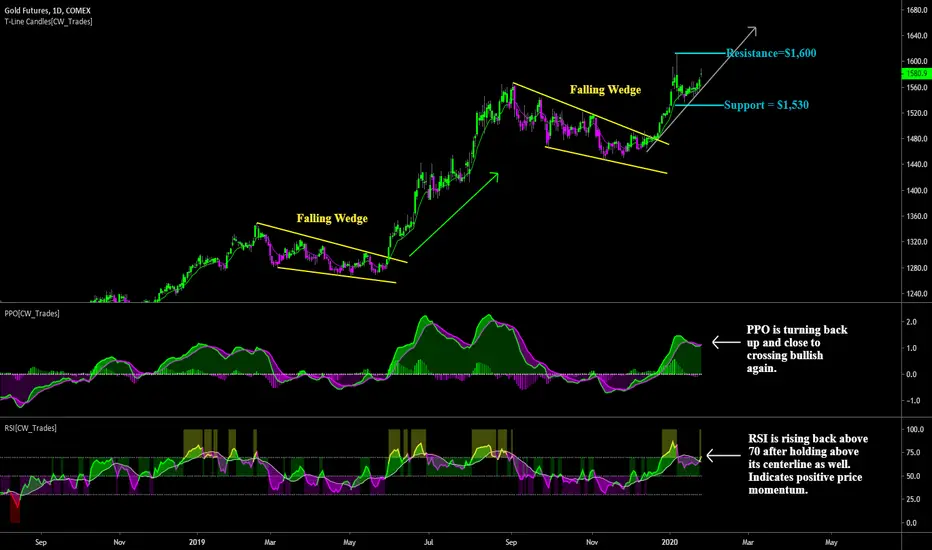
While equities have been putting in a series of bearish rising wedges, gold has two successful falling wedge breakouts on the daily chart and is looking good for a move above short-term resistance at $1,600. Price indicators are both showing a bullish trend and momentum behind price with a new advance likely coming this week. Main thing we want to see on any potential pullback is a hold above the gray arrow which represents the current support level of the uptrend. Secondary support is $1,500, price remaining above that level and bouncing again would be considered a bullish retest; a break below $1,500 would give reason for shorting.

Clause de non-responsabilité
Les informations et publications ne sont pas destinées à être, et ne constituent pas, des conseils ou recommandations financiers, d'investissement, de trading ou autres fournis ou approuvés par TradingView. Pour en savoir plus, consultez les Conditions d'utilisation.
Clause de non-responsabilité
Les informations et publications ne sont pas destinées à être, et ne constituent pas, des conseils ou recommandations financiers, d'investissement, de trading ou autres fournis ou approuvés par TradingView. Pour en savoir plus, consultez les Conditions d'utilisation.