
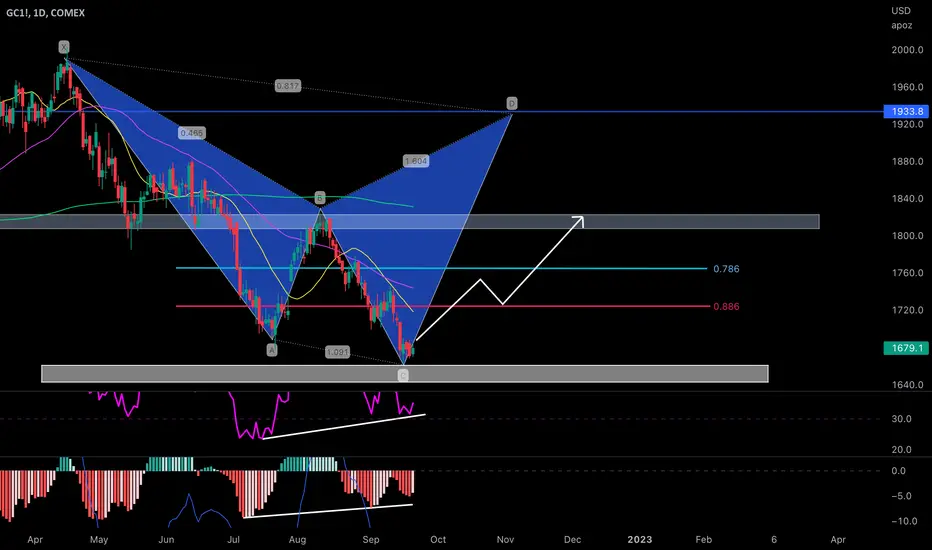
Hey y’all, i charted a possible bullish play that could potentially lead to some upside regarding GS1! Here we potentially have a alternate XABCD that’s below the typical pattern completion zone of the 786 and 886 fib retrace ratios. We are showing Class A Bullish Divergence on both oscillators IEW the RSI and MACD showing seller exhaustion and negative momentum winding down. We may see price action start to make a push upwards and go green in the next coming weeks… just my opinion on a possible outcome..

Clause de non-responsabilité
Les informations et publications ne sont pas destinées à être, et ne constituent pas, des conseils ou recommandations financiers, d'investissement, de trading ou autres fournis ou approuvés par TradingView. Pour en savoir plus, consultez les Conditions d'utilisation.
Clause de non-responsabilité
Les informations et publications ne sont pas destinées à être, et ne constituent pas, des conseils ou recommandations financiers, d'investissement, de trading ou autres fournis ou approuvés par TradingView. Pour en savoir plus, consultez les Conditions d'utilisation.