
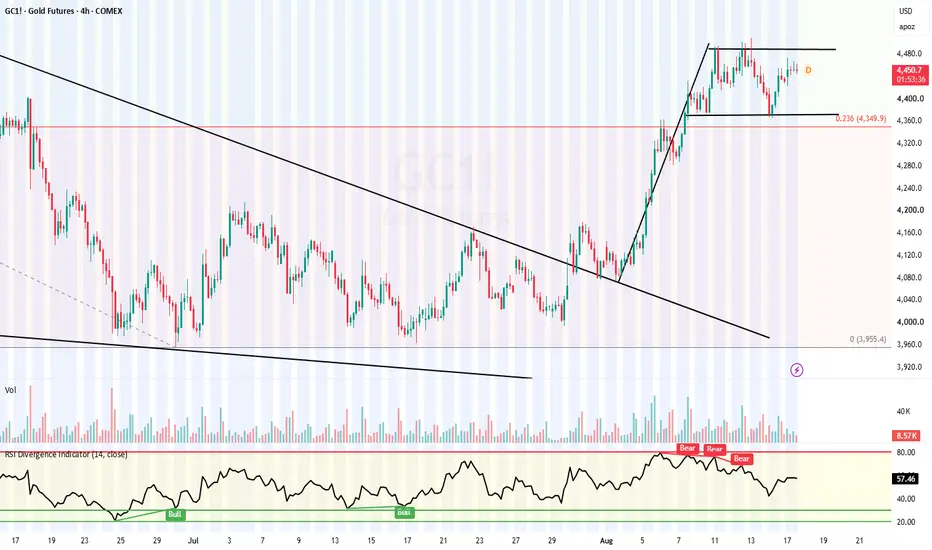
GOLD COMEX TECHNICAL ANALYSIS: BULLISH FLAG PATTERN | $4,370 SUPPORT & $4,490 BREAKOUT
GOLD COMEX — SHORT-TERM TECHNICAL VIEW
After the breakout from the Falling Wedge Pattern, Gold COMEX Futures witnessed a strong upward rally.
As discussed in our previous analysis, the 0.236 Fibonacci retracement level around $4,350 acted as an important support zone.
Previous Analysis:

CURRENT SETUP — 17 AUGUST 2026
On the 4-Hour Chart, Gold COMEX has formed a Bullish Flag Pattern following the sharp rally after the Falling Wedge breakout.
The current consolidation range is:
Flag Support: $4,370
Flag Resistance: $4,490
Any sustained 1-Hour candle close above $4,490 could confirm a bullish breakout and potentially trigger the next upward move.
TWO TRADING STRATEGIES
1. SWING TRADING STRATEGY
Look for buying opportunities around the $4,370 support zone.
Stop Loss: Below $4,340
2. BREAKOUT TRADING STRATEGY
Buy only after a confirmed breakout above $4,490.
Stop Loss: $4,465
For breakout trades, traders should preferably confirm the breakout candle on both the 15-Minute and 1-Hour Charts before entering the trade.
KEY LEVELS TO WATCH
$4,370 — Flag Support
$4,490 — Breakout Resistance
$4,340 — Swing Trade Stop Loss
$4,465 — Breakout Trade Stop Loss
SHORT-TERM VIEW:
The overall short-term structure remains BULLISH as long as Gold holds the key support zone.
Trade with proper risk management and wait for confirmation before entering breakout trades.
#Gold #GoldCOMEX #GoldFutures #GoldTrading #GoldTechnicalAnalysis #GoldAnalysis #GoldPrice #TechnicalAnalysis #BullishFlag #BreakoutTrading #CommodityTrading
GOLD COMEX — SHORT-TERM TECHNICAL VIEW
After the breakout from the Falling Wedge Pattern, Gold COMEX Futures witnessed a strong upward rally.
As discussed in our previous analysis, the 0.236 Fibonacci retracement level around $4,350 acted as an important support zone.
Previous Analysis:
CURRENT SETUP — 17 AUGUST 2026
On the 4-Hour Chart, Gold COMEX has formed a Bullish Flag Pattern following the sharp rally after the Falling Wedge breakout.
The current consolidation range is:
Flag Support: $4,370
Flag Resistance: $4,490
Any sustained 1-Hour candle close above $4,490 could confirm a bullish breakout and potentially trigger the next upward move.
TWO TRADING STRATEGIES
1. SWING TRADING STRATEGY
Look for buying opportunities around the $4,370 support zone.
Stop Loss: Below $4,340
2. BREAKOUT TRADING STRATEGY
Buy only after a confirmed breakout above $4,490.
Stop Loss: $4,465
For breakout trades, traders should preferably confirm the breakout candle on both the 15-Minute and 1-Hour Charts before entering the trade.
KEY LEVELS TO WATCH
$4,370 — Flag Support
$4,490 — Breakout Resistance
$4,340 — Swing Trade Stop Loss
$4,465 — Breakout Trade Stop Loss
SHORT-TERM VIEW:
The overall short-term structure remains BULLISH as long as Gold holds the key support zone.
Trade with proper risk management and wait for confirmation before entering breakout trades.
#Gold #GoldCOMEX #GoldFutures #GoldTrading #GoldTechnicalAnalysis #GoldAnalysis #GoldPrice #TechnicalAnalysis #BullishFlag #BreakoutTrading #CommodityTrading

Publications connexes
Clause de non-responsabilité
Les informations et publications ne sont pas destinées à être, et ne constituent pas, des conseils ou recommandations financiers, d'investissement, de trading ou autres fournis ou approuvés par TradingView. Pour en savoir plus, consultez les Conditions d'utilisation.
Publications connexes
Clause de non-responsabilité
Les informations et publications ne sont pas destinées à être, et ne constituent pas, des conseils ou recommandations financiers, d'investissement, de trading ou autres fournis ou approuvés par TradingView. Pour en savoir plus, consultez les Conditions d'utilisation.