
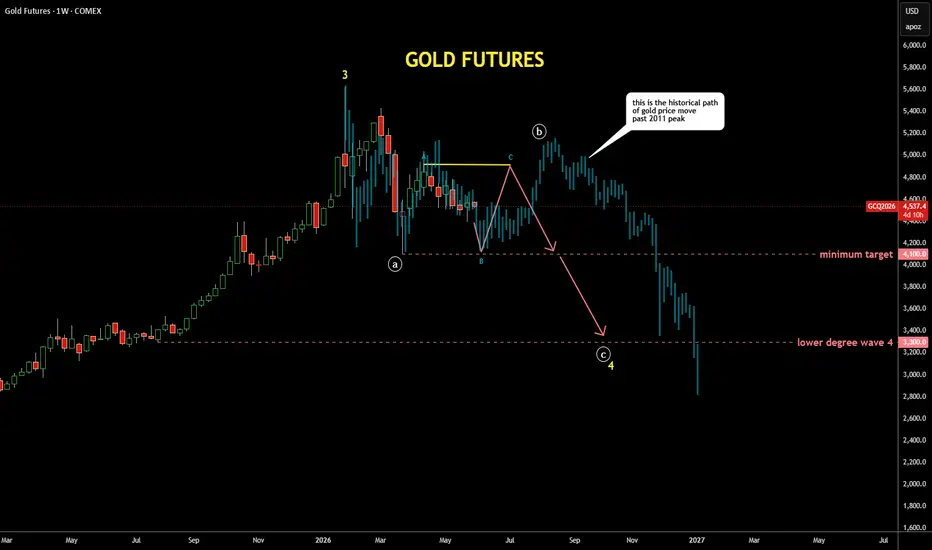
It's quite interesting exercise to check past patterns
if it is applicable to the current price structure
I scrolled back to distant 2011 where the gold peaked around $1,900,
copied the structure from there and pasted to the current peak
I fitted the bar pattern (faded blue bars) with tops and bottoms
It looks similar to the current structure as extremes align almost perfectly
It also matches with the map I posted earlier last week with bit more volatility
if it is applicable to the current price structure
I scrolled back to distant 2011 where the gold peaked around $1,900,
copied the structure from there and pasted to the current peak
I fitted the bar pattern (faded blue bars) with tops and bottoms
It looks similar to the current structure as extremes align almost perfectly
It also matches with the map I posted earlier last week with bit more volatility

Publications connexes
Clause de non-responsabilité
Les informations et publications ne sont pas destinées à être, et ne constituent pas, des conseils ou recommandations financiers, d'investissement, de trading ou autres fournis ou approuvés par TradingView. Pour en savoir plus, consultez les Conditions d'utilisation.
Publications connexes
Clause de non-responsabilité
Les informations et publications ne sont pas destinées à être, et ne constituent pas, des conseils ou recommandations financiers, d'investissement, de trading ou autres fournis ou approuvés par TradingView. Pour en savoir plus, consultez les Conditions d'utilisation.