
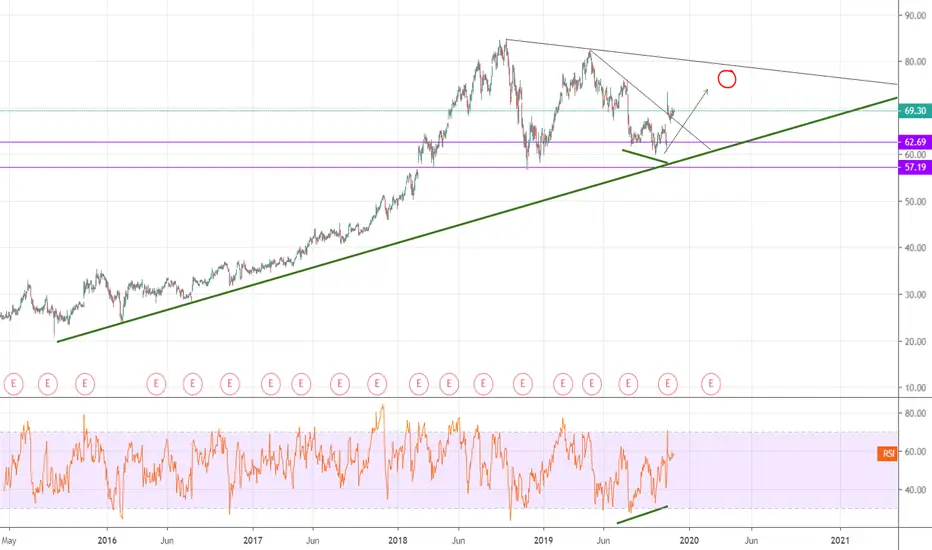
On the 1 day chart we see a Bullish Divergence appear generally indicating a reversal alongside a broken trendline, as GoDaddy announced stronger than expected financials Q3. Average analyst target price is reading $89 for 12 months. Expect resistance around $75
Note
Awaiting signal form Moving Averages, price has jumped above MA 200 line. Price may bounce off blue 13MA line, which would be short term support and could lead to another bullish signal, which we may see 'Golden Cross' signal when the gold 50MA crosses over the red 100MA.
Trade fermée: cible de profit atteinte

Clause de non-responsabilité
Les informations et publications ne sont pas destinées à être, et ne constituent pas, des conseils ou recommandations financiers, d'investissement, de trading ou autres fournis ou approuvés par TradingView. Pour en savoir plus, consultez les Conditions d'utilisation.
Clause de non-responsabilité
Les informations et publications ne sont pas destinées à être, et ne constituent pas, des conseils ou recommandations financiers, d'investissement, de trading ou autres fournis ou approuvés par TradingView. Pour en savoir plus, consultez les Conditions d'utilisation.