
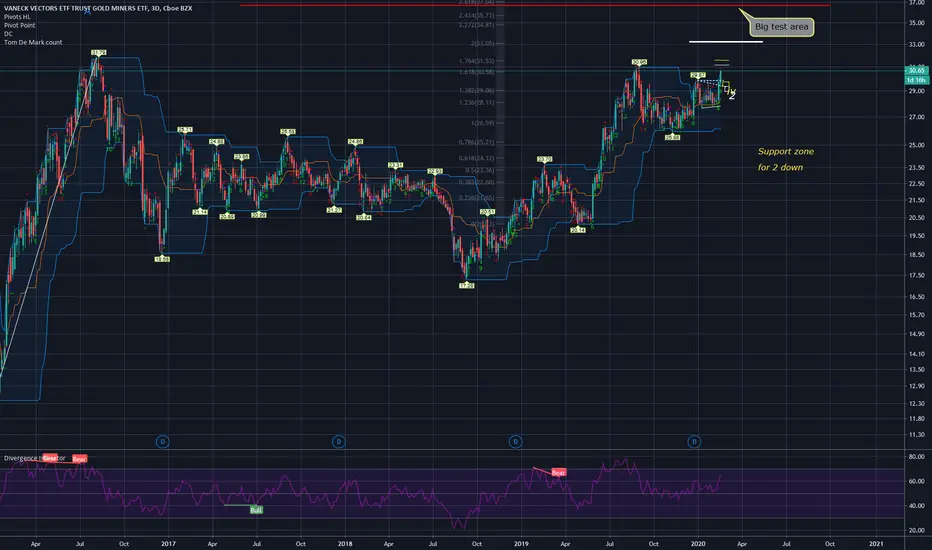
GDX 3 day chart 2/23/20
GDX is nearing a resistance zone. If GDX stops around 32 - 33 area and pulls back to the support zone then I will likely view GDX has a bull market to look forward to for a long term but if GDX extends to the red line around mid 36 area, then pulls back hard, I would view it bearish for GDX. Until now, it's been a fairly easy ride but it's time to buckle up.

GDX is nearing a resistance zone. If GDX stops around 32 - 33 area and pulls back to the support zone then I will likely view GDX has a bull market to look forward to for a long term but if GDX extends to the red line around mid 36 area, then pulls back hard, I would view it bearish for GDX. Until now, it's been a fairly easy ride but it's time to buckle up.
Note
2/27/20Pretty strong, nearly 12% pull back from the rejection of double top area.
Even when
 XAUUSD was trading positive, GDX was trading negative showing that many Miners were weak.
Path_1: Consolidate around here making a bull flag therefore creating Cup & Handle like pattern and go up. It will take some time.
Path_2: Consider a Diagonal count of 5 waves up completed. Now pull back to 24-25 area to build a base again.
Note
GDX 2 hour, 2/28/2020% down so far

Clause de non-responsabilité
Les informations et publications ne sont pas destinées à être, et ne constituent pas, des conseils ou recommandations financiers, d'investissement, de trading ou autres fournis ou approuvés par TradingView. Pour en savoir plus, consultez les Conditions d'utilisation.
Clause de non-responsabilité
Les informations et publications ne sont pas destinées à être, et ne constituent pas, des conseils ou recommandations financiers, d'investissement, de trading ou autres fournis ou approuvés par TradingView. Pour en savoir plus, consultez les Conditions d'utilisation.