
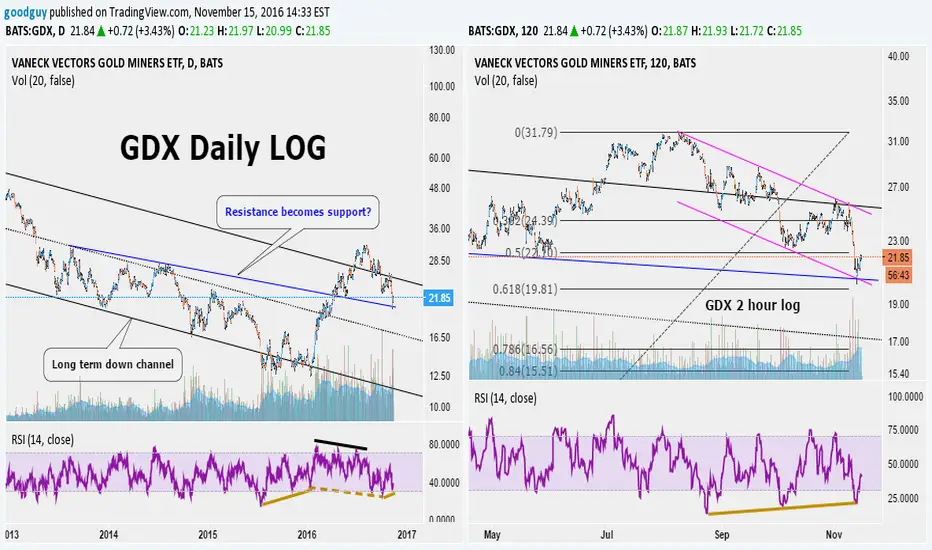
There has been a near .62 correction in the recent rise earlier this year (see 2 hour chart) and price appears to have bounced up off a potential "resistance becomes support" line. On the 2 hour chart the recent down action also has reached the downside of the channel. The daily RSI shows a positive reversal followed by a bullish divergence which as I have mentioned before often precedes a reversal.
Process through your own approach. Hope this is helpful. Feedback + or - always appreciated.
Process through your own approach. Hope this is helpful. Feedback + or - always appreciated.

Clause de non-responsabilité
Les informations et publications ne sont pas destinées à être, et ne constituent pas, des conseils ou recommandations financiers, d'investissement, de trading ou autres fournis ou approuvés par TradingView. Pour en savoir plus, consultez les Conditions d'utilisation.
Clause de non-responsabilité
Les informations et publications ne sont pas destinées à être, et ne constituent pas, des conseils ou recommandations financiers, d'investissement, de trading ou autres fournis ou approuvés par TradingView. Pour en savoir plus, consultez les Conditions d'utilisation.