
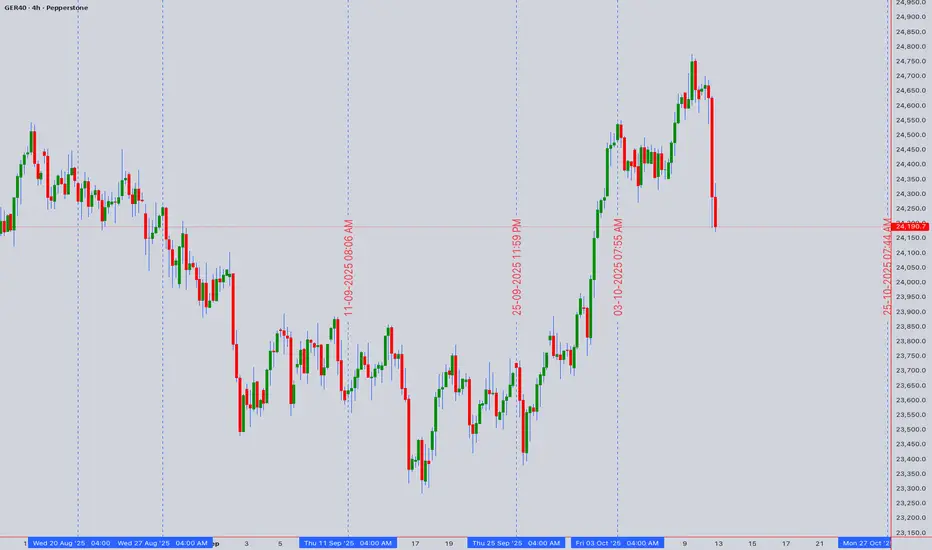
GER40 (DAX) Bulls in Control, But Overbought Signals Flash Technical Forecast:
Asset: GER40 (DAX Index)
Closing Price: 24,190.7 (as of 11th Oct 2025) USTC+4
Analysis Timeframe: Intraday (1H/4H) & Swing (D/W)
1. High-Level Market Structure & Context
The GER40 maintains a robust bullish trend on higher timeframes, trading well above its key Daily and Weekly Moving Averages. However, the recent ascent has pushed the index into overbought territory on intraday charts, suggesting a potential for a short-term pullback or consolidation before the next leg higher. Geopolitical stability and ECB policy expectations remain key drivers.
2. Multi-Timeframe Technical Breakdown
Primary Trend (Daily/Weekly): Bullish
Elliott Wave: The index appears to be in a powerful Wave 3 impulse wave on the daily chart. A minor Wave 4 pullback is anticipated, which would be a healthy correction and a buying opportunity for the subsequent Wave 5.
Ichimoku Cloud: The price is far above the Daily Cloud (Kumo), confirming the strong bullish trend. The Lagging Span (Chikou Span) is also well above the price action of 26 periods ago.
Moving Averages: The Golden Cross (50 EMA > 200 EMA) is firmly intact on the daily chart, providing dynamic support.
Short-Term Outlook (4H/1H): Caution - Overbought
RSI Divergence: The 4H RSI is showing a clear bearish divergence, forming lower highs while price makes higher highs. This is a strong warning sign of weakening momentum and an impending pullback.
Bollinger Bands: The price is riding the upper band on the 4H chart, a classic sign of an overextended move.
Wyckoff Theory: The market shows signs of a potential upthrust or a bull trap formation near the 24,250 resistance. A failure to hold gains here could lead to a reaction back to the support zone.
3. Key Price Levels & Patterns
Resistance: 24,250 - 24,350 (Recent highs & Upper Bollinger Band)
Immediate Support: 24,000 (Psychological level & recent swing low)
Strong Support: 23,800 (50-period EMA on 4H & Fibonacci 38.2% retracement)
Major Support: 23,500 (200 EMA on Daily & Wave 4 target)
A Bearish Gartley or Bat harmonic pattern is forming, suggesting a potential reversal at the 24,250-24,350 PRZ (Potential Reversal Zone).
4. Actionable Trading Plan
Intraday Strategy (Next 1-2 Days):
Scenario A (Short Setup): Look for a rejection at the 24,250-24,350 resistance zone, confirmed by a bearish candlestick pattern (e.g., Bearish Engulfing, Shooting Star) and a turn down in the RSI.
Sell Entry: 24,260 - 24,320
Stop Loss: 24,450
Take Profit 1: 24,050
Take Profit 2: 23,850
Scenario B (Long Setup): A buy-the-dip opportunity emerges on a pullback to the 23,800 - 23,850 support cluster, with a bullish reversal candlestick and RSI recovering from oversold (<40).
Buy Entry: 23,820 - 23,870
Stop Loss: 23,700
Take Profit 1: 24,100
Take Profit 2: 24,250
Swing Trading Strategy (Next 1-2 Weeks):
Bias: Bullish overall. The primary goal is to enter long on dips.
Ideal Long Entry: A deeper pullback to the 23,500 - 23,600 zone would present a high-probability, low-risk long entry for a swing trade targeting new highs above 24,500.
Invalidation: A daily close below 23,450 would invalidate the immediate bullish Elliott Wave count and suggest a deeper correction is underway.
5. Volume & Momentum Insight
VWAP & Volume: The Anchored VWAP (from a recent low) shows the price is extended above it, supporting the overbought thesis. Volume has been declining on the most recent push higher, indicating a lack of strong conviction—a characteristic of a bull trap.
Conclusion: While the long-term trend for the GER40 is unequivocally bullish, the short-term setup favors a corrective pullback. Intraday traders can scout for short opportunities at resistance, while swing traders should patiently wait for a better risk/reward long entry at lower support levels. Always manage your risk.
Disclaimer: This is technical analysis, not financial advice. Trade at your own risk.

I am nothing @shunya.trade
Clause de non-responsabilité
Les informations et publications ne sont pas destinées à être, et ne constituent pas, des conseils ou recommandations financiers, d'investissement, de trading ou autres fournis ou approuvés par TradingView. Pour en savoir plus, consultez les Conditions d'utilisation.
I am nothing @shunya.trade
Clause de non-responsabilité
Les informations et publications ne sont pas destinées à être, et ne constituent pas, des conseils ou recommandations financiers, d'investissement, de trading ou autres fournis ou approuvés par TradingView. Pour en savoir plus, consultez les Conditions d'utilisation.