
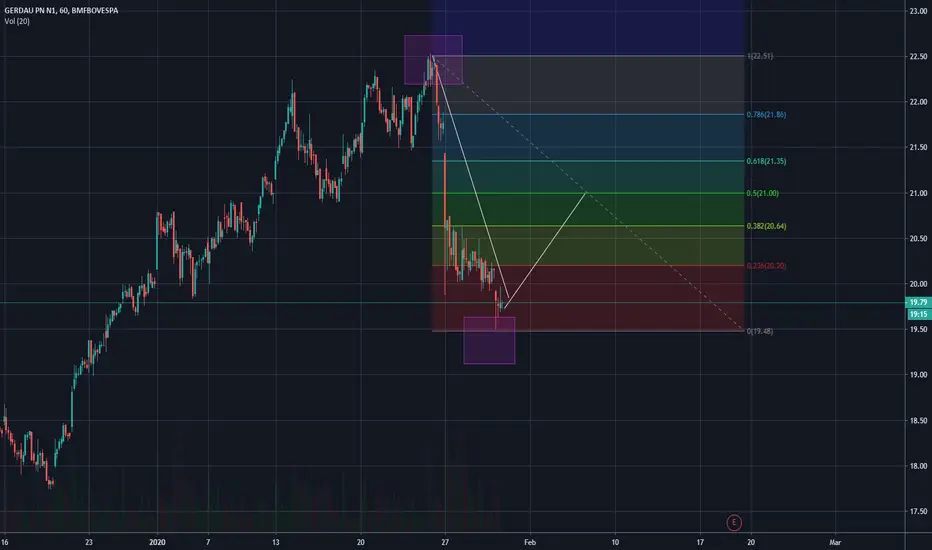
Rectangles represent the maximum and minimum values.
The white line represents the movement that I assume will happen.
The white line represents the movement that I assume will happen.
Note
Therefore there was a rise up to 0.382, whete my exit point should have been. The line did not cross 0.5, so I will assume it will continue on a low trend.Note
After the 0.382 retraction, the candles reached 0.5 fibonacci, where was my point of sale.I bought at 19.80 and sold at 20.95 making a 6% profit.

Clause de non-responsabilité
Les informations et publications ne sont pas destinées à être, et ne constituent pas, des conseils ou recommandations financiers, d'investissement, de trading ou autres fournis ou approuvés par TradingView. Pour en savoir plus, consultez les Conditions d'utilisation.
Clause de non-responsabilité
Les informations et publications ne sont pas destinées à être, et ne constituent pas, des conseils ou recommandations financiers, d'investissement, de trading ou autres fournis ou approuvés par TradingView. Pour en savoir plus, consultez les Conditions d'utilisation.