$GLCH projection based on the LOG chart
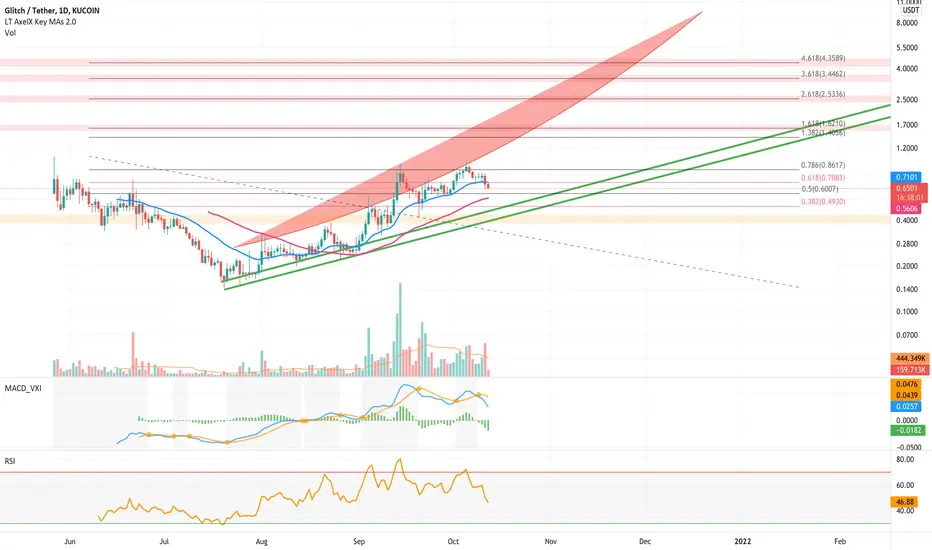
My previous model on GGCH is broken, this model only looked at linear data. Since most of the moves in crypto are exponential most of the times. It could be better to take the LOG chart in consideration...
In this chart potential upside and downside is greater.
The support band of the LOG chart shows a potential bottom between $0.47 - $0.40.
In this chart potential upside and downside is greater.
The support band of the LOG chart shows a potential bottom between $0.47 - $0.40.

Clause de non-responsabilité
Les informations et publications ne sont pas destinées à être, et ne constituent pas, des conseils ou recommandations financiers, d'investissement, de trading ou autres fournis ou approuvés par TradingView. Pour en savoir plus, consultez les Conditions d'utilisation.
Clause de non-responsabilité
Les informations et publications ne sont pas destinées à être, et ne constituent pas, des conseils ou recommandations financiers, d'investissement, de trading ou autres fournis ou approuvés par TradingView. Pour en savoir plus, consultez les Conditions d'utilisation.